

Health Care has been one of the stronger sectors for 2014, after being a strong out-performer in 2013. Based on the data collected by the Stock Trader’s Almanac, August starts a historically bullish period of time for Health Care (XLV), so I thought it would be nice to take a look at a chart of the Health Care Select Sector SPDR ETF (XLV).
Most recently, like the S&P 500, a negative divergence in momentum developed as XLV attempted to make a new high in July. The Relative Strength Index (RSI) indicator is now just above its support level which was created during previous declines in 2013 and 2014. I would like to see this level of support hold to keep momentum in a bullish range for XLV.
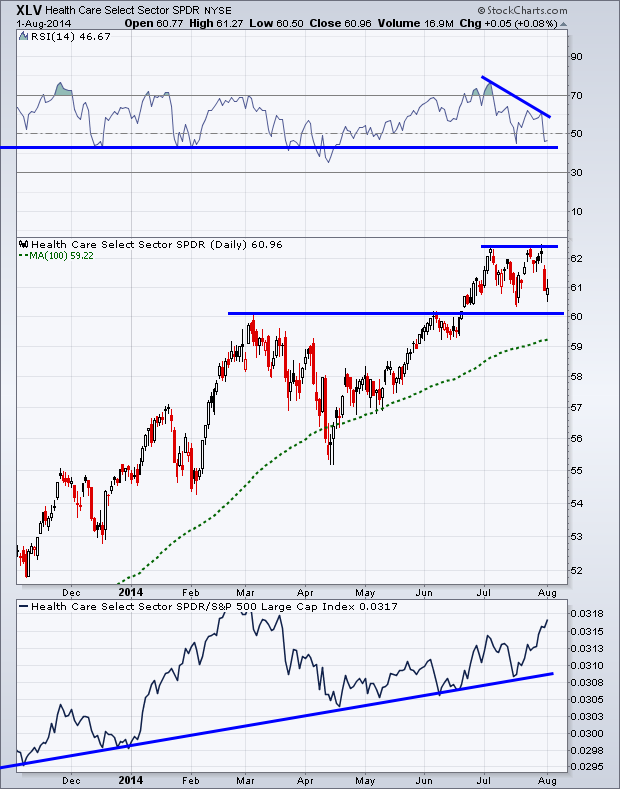
Price is also above its potential support of the prior high in March and June, keeping the ETF in a solid up trend. If we see price break down then I’ll be looking to the 100-day Moving Average as the next support level, which we last saw tested in April. In the bottom panel of the chart I’ve included the ratio between XLV and the S&P 500. As the line rises we know that Health Care is out-performing, by either rising more or falling less, the overall equity market.
With seasonality showing a bullish bias for health care and the current strong relative performance, it’s likely we see XLV hold above support and continue its current up trend.
Disclaimer: The information contained in this article should not be construed as investment advice, research, or an offer to buy or sell securities. Everything written here is meant for educational and entertainment purposes only. I or my affiliates may hold positions in securities mentioned.
= = =
Read the Summer issue of the TraderPlanet Journal here!

