
Heating oil is an interesting market at this time of year, and I think prospects look bullish. It is particularly well-suited to pivot-point techniques, which I will discuss in further detail, as well as offer some trading strategies you might consider.
You can’t get into heating oil without discussing the weather forecast, as this market is primarily weather-driven. We have cold weather dominating the near-term outlook for the energy markets, and the grains. We are seeing lows well below the averages projected nearly everywhere but the Gulf Coast and Southwest. This will have a big impact on demand and the outlook for heating oil prices if the forecast holds.
In addition, the first component of the Dow Jones Industrial Average to report third-quarter earnings, Alcoa, gave a favorable profit report last week. This raises the hopes for increases in overall industrial fuel demand.
Outside markets are also supportive of heating oil. The weakening dollar makes heating oil cheaper for foreign buyers, and the firming of the stock market as we emerge from a global recession is also a positive for the energy markets.
The latest CFTC Commitments of Traders report released Friday, October 9, showed that the big commercial players were net short 39,215 contracts, which to me indicates a short-term correction back toward the upward sloping trend line on the daily chart is likely before prices head sharply higher. This should shake out weak longs and give new long-term speculators a chance to buy at a more favorable price.
Technical Factors
Heating oil has been in a bullish ascending triangle pattern since mid-June. Reversal point one is indicated on the chart on June 16, reversal point two was on July 13, reversal point three was on August 6 and reversal point four was on September 25. We have an almost horizontal upper trendline that’s been hit twice, and a sharply sloping trendline resolved by points two and four.
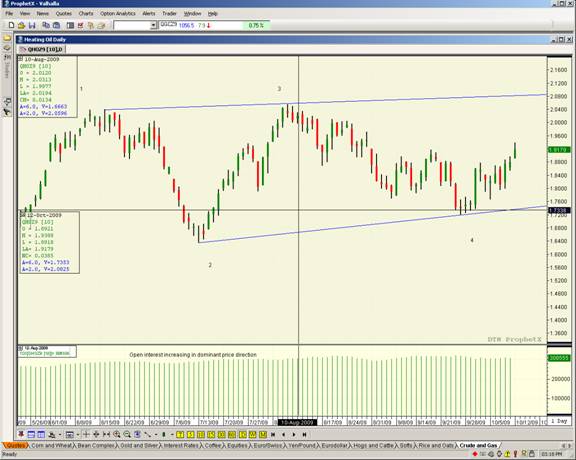
Open interest has been increasing with price increases, and decreasing on pullbacks. Typically, with in this type of consolidation pattern, the probability is for a breakout to the upside. I would project a move to $2.46 a gallon. On a breakout above the upper trendline, I’d recommend getting long. I don’t see this until mid- to late-December, however, and into early February. I believe that heating oil is short-term overbought, so if you are a position trader, wait for a test of the upward sloping trendline to get long.
Trading Strategies
If you are bullish heating oil, you could consider a call spread in January or February contracts. Consider buying the $2 call on a breakout, and sell $2.20 or $2.40 calls as a hedge. Add positions on a daily close above the upper trendline of the triangle. By selling the calls, you are buying yourself a little protection.
When it comes to trading options, volume is almost always better in open outcry versus the Globex electronic platform (which is not generally the case in futures). Pick up the phone and call your Trade Desk if you are a Lind-Waldock client, or give me a ring and I’ll be happy to help you with your order. Often, low volume on Globex results in a much different bid/ask, which is generally tighter if you trade via the floor.
You could also consider trading the ICE U.S. Dollar Index contract as a hedge against your heating oil futures trades, as these markets tend to trade inversely to each other. If you are less conservative, you could consider trading corn as a hedge, which has seen a pretty impressive rally. On Monday, October 12, December corn futures rose 19 cents a bushel to $3.81 ¼, driven by cold weather premiums. If we see milder weather, we’d likely see corn fall more sharply than heating oil, so you could consider a short corn trade as a hedge against your long heating oil position as well.
Markets often move in certain ways under certain seasonal conditions, which is factored into the price of futures. Heating oil has seen a short-term equilibrium between supply and demand, but I believe there will be a shift in conditions to show an imbalance. I think that will cause prices to rise sharply over the next few months.
Pivot-Point Trading
Heating oil is a great market for pivot point trading. Pivot-points are basically support and resistance levels based on the prior period’s high, low and closing prices. There are a variety of pivot values in which you can base your analysis; you can use daily, weekly, or even hourly data. My example is based on the high, low and close for the prior day’s session. But you can pick your own timeframe. Although it’s not a perfect science, one thing traders like about pivots is that they give structure to each trading day. You can get traditional support and resistance points to enter and exit trades, and it can offer a disciplined trader a measure of confidence.
The pivot points are plotted as horizontal levels. The pivot point is a fulcrum for the day’s trade. It’s where buyers and sellers meet to determine the price action. The support and resistance plotted around the levels are just that. Your bias is determined by the pivot point. When prices are above the pivot, you’d want to be bullish, and when prices are below the pivot, you’d want to be bearish.
To calculate the basic pivot (the red line on the next chart), I add the high, low, and close of the prior period, and then divide by three. Resistance one (R1) is two times the pivot point, minus the low; support one is two times pivot, minus the high; resistance two (R2) is the pivot plus resistance minus support; and support two (S2) is the pivot minus resistance minus support.
For the October 9, 2009, session, the high in heating oil was $1.8970, the low was $1.8542 and the close was $1.8794. So the pivot is $1.8768, R1 was $1.8995, R2 was at $1.9197 and S2 was $1.8339.
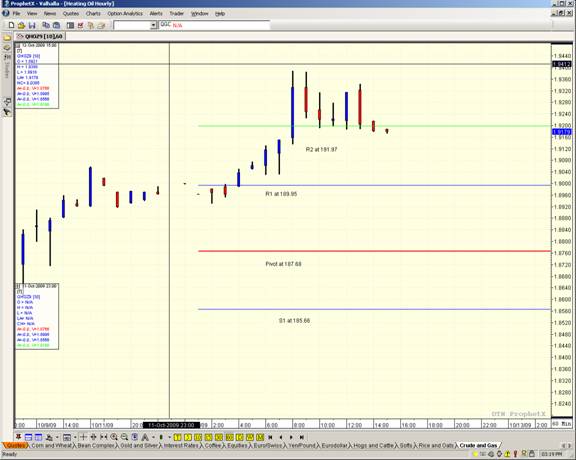
I would recommend buying on an hourly breakout above the pivot point, or sell on an hourly breakout below it. If we have an upside breakout, you would cover some positions at R1, then move your stop to breakeven, then move your stop again to R2 and try to cover the rest.
Prices in December heating oil opened above the pivot level on Monday, October 12, so the market started off bullish. You might have considered taking a position based on this action. You would want to look for a good buffer against R1, maybe about five points above, and set a buy-stop there. Most likely, you would’ve missed the first breakout, as it occurred in the early morning hours.
The next breakout represented by the long blue bar on the right side of the chart below occurred at 8 a.m. CT, which may have offered some traders an opportunity to establish a position. There was no reason to believe the stock market would step back at that point, not to mention, it was cold outside, and that should support heating oil.
Looking at the chart, you might have waited for a breakout above R1, and put a stop at R2, or entered a trade above R2, near $1.9202. When you buy above R2, you don’t have a real clear objective. I would set a limit order that you are comfortable with. If you had the luxury of watching, the most logical exit point would be the failure of the second test of the high, represented by the next red candle following the large blue candle. This is just one example in one market of how to apply the pivot-point technique.
Feel free to contact me with any questions you have about the markets, pivot-points or specific strategies for your unique situation.
Andrew Segal is a Senior Market Strategist with Lind Plus, Lind-Waldock’s broker-assisted division. He can be reached at 800-924-1060 or via email at asegal@lind-waldock.com.
You can hear market commentary from Lind-Waldock market strategists through our weekly Lind Plus Markets on the Move webinars . These interactive, live webinars are free to attend. To sign up, visit https://www.lind-waldock.com/events/calendar.shtml . Lind-Waldock also offers other educational resources to help your learn more about futures trading, including free simulated trading. Visit www.lind-waldock.com.
Past performance is not necessarily indicative of future trading results. Trading advice is based on information taken from trade and statistical services and other sources which Lind-Waldock believes are reliable. We do not guarantee that such information is accurate or complete and it should not be relied upon as such. Trading advice reflects our good faith judgment at a specific time and is subject to change without notice. There is no guarantee that the advice we give will result in profitable trades. All trading decisions will be made by the account holder.
Futures trading involves substantial risk of loss and is not suitable for all investors. © 2009 MF Global Ltd. All Rights Reserved. Futures Brokers, Commodity Brokers and Online Futures Trading. 141 West Jackson Boulevard, Suite 1400-A, Chicago, IL 60604.

