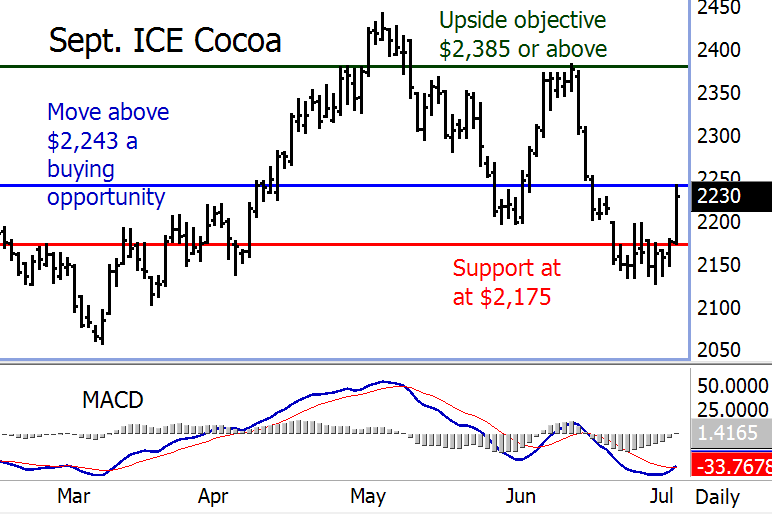
September ICE cocoa futures a buying opportunity on more price strength.
See on the daily bar chart for September ICE cocoa futures that prices Friday popped to a fresh three-week high and also saw a bullish upside “breakout” from the congestion area on the chart. See, too, at the bottom of the chart that the Moving Average Convergence Divergence (MACD) indicator has also just produced a bullish line crossover signal, whereby the thick blue MACD line crossed above the thin red “trigger” line. See how well the MACD line crossover signals have worked at providing buy and sell signals the past few months. A move above chart resistance at Friday’s high of $2,243 would become a buying opportunity. The upside price objective would be $2,385, or above. Technical support, for which to place a protective sell stop just below, is located at Friday’s low of $2,175.


