
The head-and-shoulders pattern is probably the best known and most often misidentified of all the major reversal patterns. There are a number of nuances involved in properly identifying this pattern, so it warrants some discussion. The head-and-shoulders pattern manifests when a major trend begins to lose momentum, but then levels off while challenging support or resistance levels, and finally reverses. The purpose of this article is to help you understand what a market is doing when a potential a head-and-shoulders pattern is forming, and give you the tools to properly identify the pattern’s signals.
Let’s look at the head-and-shoulders bottom formation. Before a head-and-shoulders bottom reversal can occur, it is essential that a major trend be in place. A downtrend is characterized by a series of lower highs and lower lows. Ideally, a trend is accompanied by higher volume occurring on days that close in the direction of the existing trend. Several price moves need to occur in order to identify a head-and-shoulders reversal of this trend, which are discussed below and illustrated in the recent chart of the Japanese yen.
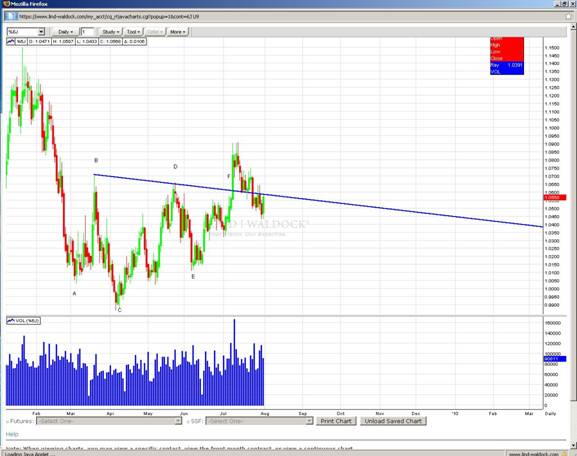
- Next, an even lower low is forged to Point C, the head. It is critical that this new low is made on even lighter volume than the previous move to Point A. At this point, the chartist can begin to suspect that a head-and-shoulders pattern is forming, but it is too early to take any trading action. A trader must wait for the pattern to unfold further, but a wise trader will make a mental note to watch the chart carefully.
- If prices then rally above the previous low at Point A to a Point D, we can create a potential neckline for the breakout from this pattern. Note that Point D does not necessarily need to be higher than Point B. In either case, the chartist would draw a line from Point B to Point D, and then sit back and wait for one final price decline to occur.
- A third decline to a Point E, the right shoulder, occurs on even lighter volume than the last decline, often retracing about one-half to two-thirds of the move. The failure of this move to create a new low fulfills half of the requirement for a new uptrend, specifically, a higher low. Here, we have an inactive head-and-shoulders pattern, and the conservative chartist is waiting for the final condition to occur before taking action.
- Finally, a price rally leading to a breakout close at Point E, above the “neckline” drawn from Point B to Point D, should occur on high volume and increasing open interest. This activates the pattern, and many chartists would be getting long on a buy stop, or at the market once a close above the neckline occurs on an hourly or daily basis.
- The chartist will now subtract the price at Point E by the price at Point C. This value should be added to the price at the breakout of the neckline to determine the minimum price objective–this is the profit objective where you can hope to take profits if the head-and-shoulders pattern successfully predicts a major price reversal. For instance, in the Japanese yen chart, the difference between Point E and Point C is 7.41 points. By adding 7.41 points to the breakout level of 106.08, we can determine a level to take profits: 113.49. Note that prices in an active head-and-shoulders bottom will often test the neckline before moving into a solid uptrend, and that the yen has been successfully testing this support during the end of July.
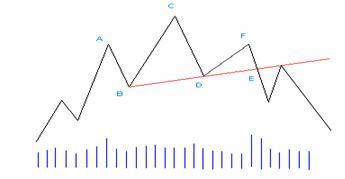
The opposite of this pattern would be the head-and-shoulders top, which is simply the reverse of the aforementioned scenario (See illustration below).
Please feel free to give us a call if you have any questions on this topic, or how to develop a customized trading strategy based on what’s taking shape in today’s markets.
Andrew Segal is a Senior Market Strategist with Lind Plus, Lind-Waldock’s broker-assisted division. He can be reached at 800-924-1060 or via email at asegal@lind-waldock.com. Stuart Kaufman is a Senior Market Strategist with Lind Plus. He can be reached at 800-924-1060 or via email at skaufman@lind-waldock.com.
Futures trading involves substantial risk of loss and is not suitable for all investors.
Past performance is not necessarily indicative of future trading results. Trading advice is based on information taken from trade and statistical services and other sources which Lind-Waldock believes are reliable. We do not guarantee that such information is accurate or complete and it should not be relied upon as such. Trading advice reflects our good faith judgment at a specific time and is subject to change without notice. There is no guarantee that the advice we give will result in profitable trades. All trading decisions will be made by the account holder.
© 2009 MF Global Ltd. All Rights Reserved.

