
March 23, 2010: The Indian stock market hit resistance calling for a re-look of your exposure to India
Let us look at the chart of benchmark index of the Indian stock market–Sensex– to identify market trends.
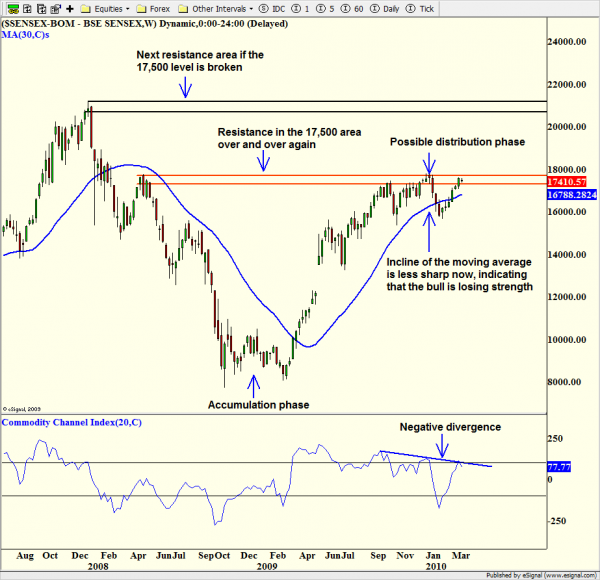
First look at the two red lines in 17,500 area. This is an area of resistance from where prices fell a few times. It was the origin of a big drop in 2008 and prices returned to that area twice in 2009 and now in 2010. Given the fact that prices have not been able to clear the area marked by red lines show that there is substantial supply of stocks in that area. Also notice that prices fell sharply from that area and took a longer time to go back up indicating the strength of sellers.
For the latest swing trades please see this report: Indian Markets: Swing trades on Sensex 30 stocks
Now let’s look at the technical indicator called the commodity channel index (CCI) at the bottom of the chart. You will notice that CCI has been making lower highs, even though the Sensex has made equal and even a higher high. Technical analysts call this negative divergence–usually and early warning that the markets are getting weak. Also notice that the CCI went above 100 and then fell below it on Monday, which is sell signal.
The next we’ll to look at the 30-week moving average, which is used by institutional investors to determine market trend. Even though the trend is still up, notice that the moving average is not rising as sharply as it did in 2009. This shows that the bull is losing strength. The 30-week moving average is also tracked by investors who use the four stages of the markets to enter and exit positions. Investors who use the four stages of market essentially state that markets bottom out at the accumulation phase (first stage) when prices are moving sideways. During this stage institutional investors buy into the market. You’ll notice that the Sensex was in it’s first stage between October 2008 and March 2009.
In the second stage the market rallies like the Sensex did in 2009 and in the third stage the markets move sideways again, before falling (fourth stage). It is very possible that from September 2009 to now the Sensex is in the third phase and getting ready to fall. The fourth stage is confirmed only when 30-week moving average is sloping down and prices trade below the average. Unfortunately, by the time the fourth stage is confirmed, prices would have moved substantially, reducing our profit margin. Hence, we sell or short when prices hit supply, like the Sensex is doing now.
Caveats:
Notice that the Sensex has hit resistance a few times, which is reducing supply in that region. This increases the possibility that the Sensex could break out higher. If it does the next resistance area ss shown by the two black lines.

