
The rally has lasted just a few days but it has already changed the mindset of the media and average investor. Last week it was panic, could the market retest the lows from early March, now it is whether or not the S&P 500 will hit 1000 by the end of the week. The sentiment and psychology of the markets is changing more quickly than ever. Technology has made that possible, as the media streams through every avenue of our daily lives. As quickly as the markets and individuals were falling off a cliff, the charts told us the market was going to rally off a pivot called last Friday by Chief Market Strategists at InTheMoneyStocks.com. Now the rally has started and the bullish sentiment is nearing the highs. Is the market going to sell hard or continue to new highs of the year?
One piece of information I wish to discuss is the head and shoulders patterns that were so easily picked up by the media. The media hyped the head and shoulders so much it was destined to fail. This is another classic psychological trick and something I utilize in a contrarian manner. If too many people know about a bearish pattern, it will fail because too many people jump on the short side. Think of a see-saw or a scale. For the markets to stay perfectly still, at all times there must be an equal amount of longs and shorts. As soon as that becomes distored, the markets will swing the opposite way of the larger group. The head and shoulder pattern on the SPY and S&P 500 failed with the monster move Monday. This pattern failed as soon as the neckline was closed above. This happened as of Monday’s close. Frankly, there were just too many people short/holding puts. See chart below.
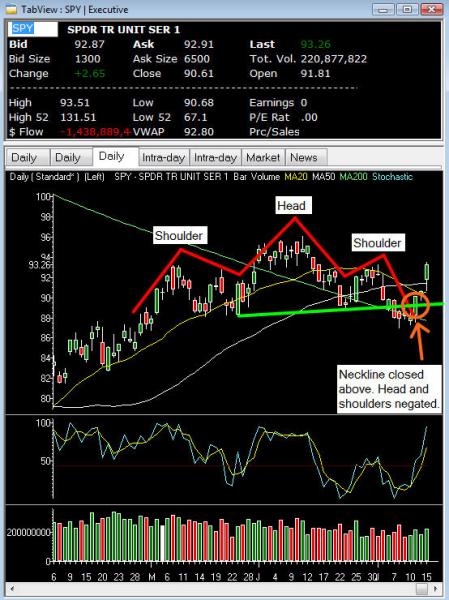
While this pattern failed, tricking all the shorts, catching the put holders off guard on options expiration week, it may not be the end of the wild swings. The only chart not to negate the head and shouldrs breakdown is XOM. As of the close of trading today, XOM closed on the neckline. See chart below.
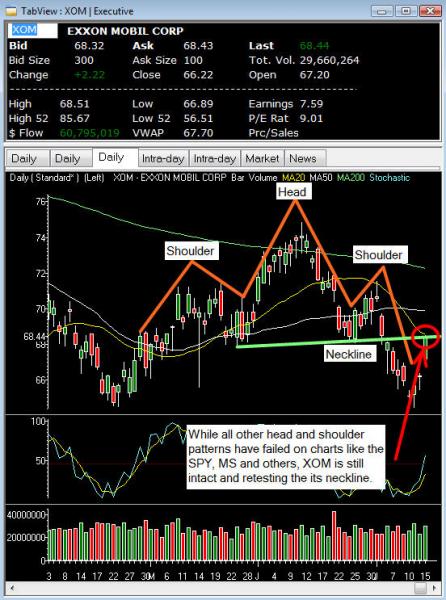
A close higher today, and it would have negated the pattern. So this leaves us to question. Does this tell us something about tomorrow? Does this tell us something about the next few days? XOM is a leading stock. It carries a lot of weight and maybe, just maybe, it is telling us something. All of a sudden the markets are ripping higher again, the closely followed bearish pattern on the S&P 500 has failed signaling a bullish move. However, the little talked about head and shoulders pattern on XOM is still intact. Should we be worried? Only time will tell. Pattern tells us the future, learn it and profit.
Source: InTheMoneyStocks
RealTick graphics used with permission of Townsend Analytics, Ltd. 1986-2009 townsend Analytics, Ltd. All Rights Reserved. RealTick is a registered trademark of Townsend Analytics, Ltd

