Overview
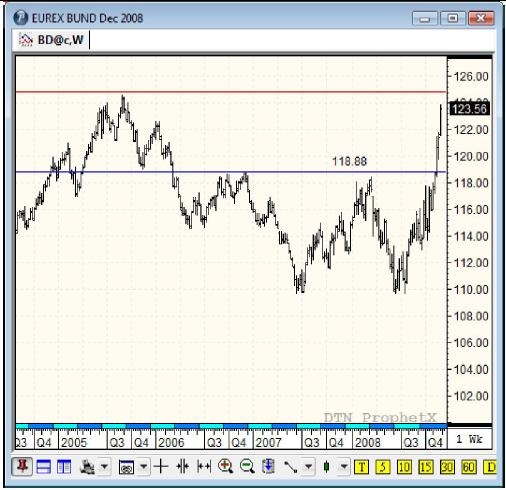
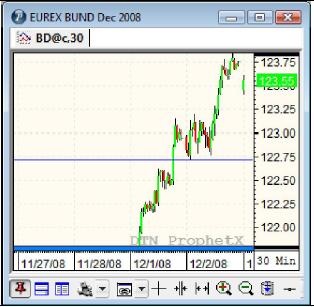
The Bund remains as strong as an Ox with no sign of letting up just yet. Our larger chart today is the weekly chart whichshows that we are fast approaching a major resistance level at 124.60. This was the high from the 29th of August 2005 and will be a real test as there should be a decent mount of profit taking as we reach this area. The first decent support of note comes by going back down the time frames toour smaller 30 minute chart where 122.71 is the clear level.


Indicators in Play
Day traders often go down through the time frames to find intra day resistance and support that do not show up on their daily charts. This can give good entry levels to add to a position or warn that the picture is changing. This works just as well going up to weekly charts to keep focus on the bigger picture.


Summary
It a case of the trend is your friend here as we now head for 124.60.


