

When the equity market is in the red I’m always looking for what is outperforming domestic markets. This is one way we can find potential leaders if and when the market rebounds, assuming we are not in a protracted down trend. Canada appears to be getting ready to fit that bill.
During Monday’s sell off we saw the iShares Canada ETF ($EWC) outpace the S&P 500 by 98 basis points. This caught my attention since U.S. stocks have been outperforming Canadian stocks for over a year. So when investors begin to show preference to the beaten down Canadian market relative to its southern neighbor this may be a sign of bullishness to come. While the Canadian ETF did sell off on Monday, it hit support at its previous week’s low while the S&P made a new low.
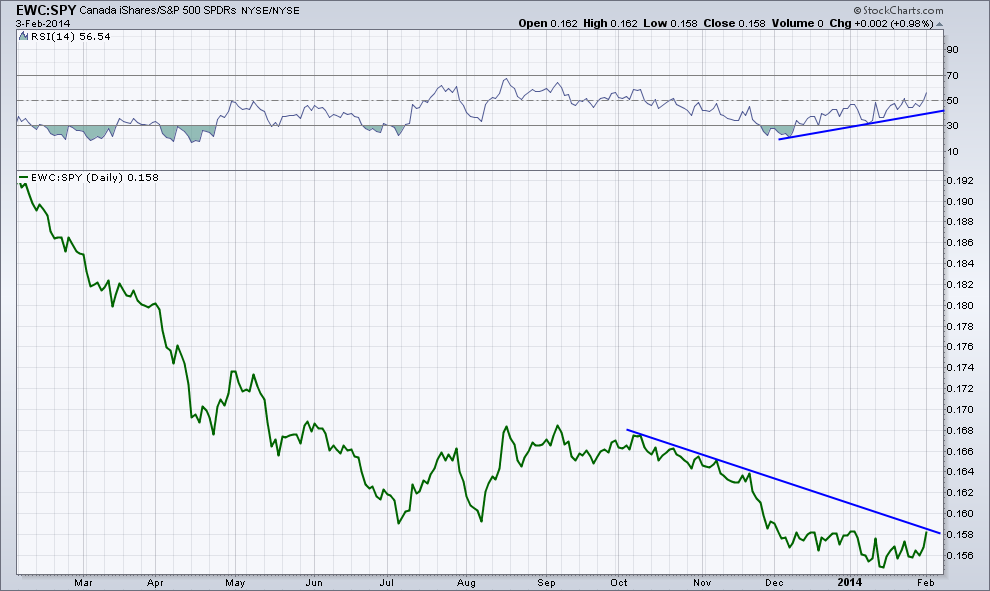
Looking at the relative performance chart of $EWC and $SPY, we can see that when the green line is falling, $SPY is rising more or falling less than $EWC. With Monday’s bullish relative move in $EWC we are now approaching the multi-month trend line since October of last year. We also have a bullish divergence in the Relative Strength Index (RSI), a momentum indicator. As the ratio between these two equity ETFs made lower lows, the RSI indicator began to make higher lows which is a positive sign for Canadian equities relative to U.S. equities.
Going forward I’ll be watching to see how the ratio between $EWC and $SPY acts if it’s able to get to resistance and if $EWC is able to continue to outpace the S&P 500 while confirming the bullish move taking place in momentum.
Disclaimer: The information contained in this article should not be construed as investment advice, research, or an offer to buy or sell securities. Everything written here is meant for educational and entertainment purposes only. I or my affiliates may hold positions in securities mentioned.

