

Gold prices have continued to decline since the beginning of the month after price failed to recapture the 50-day SMA. The renewed selling pressure has brought the precious metal near 12-week lows. After Friday’s blockbuster Non-Farm Payroll report, optimism grew for the Federal Reserve to hike rates in September. An improving US economy, with a tightening Fed, and low inflation, could lead to lower gold prices. If gold continues to make lower lows and lower highs, we could finally see break below the $1,130 and $1,400 range that has been in place for the past couple of years.
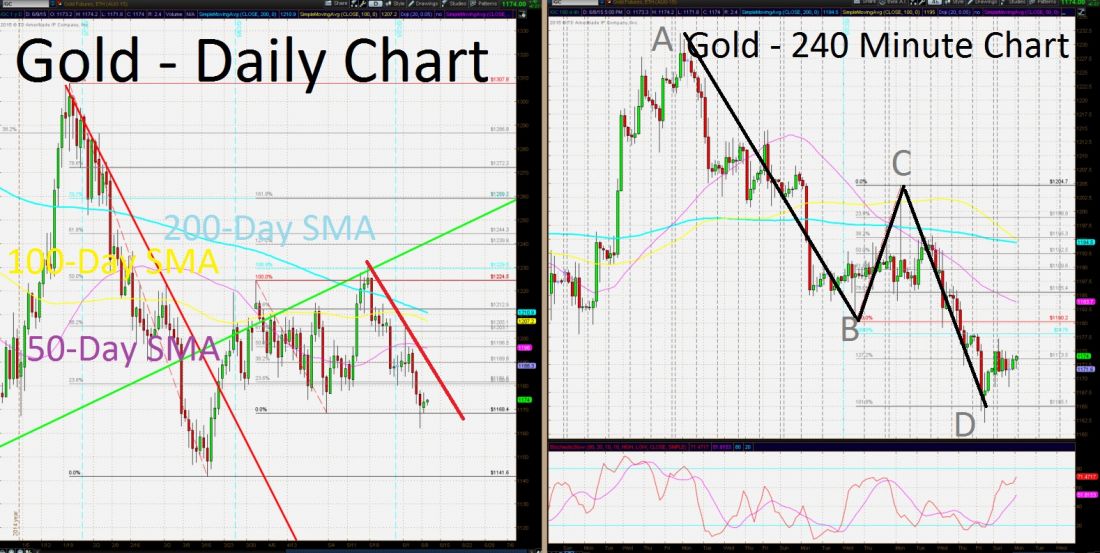
Price action on the 240-minute gold chart is displaying the potential formation of a bullish ABCD pattern. The bullish reversal is targeted with point D, which is the 161.8% Fibonacci expansion level of the B to C leg. If valid, we could see a rebound and partial recovery reach the $1,183 region. Only a daily close above the $1,210 level could confirm a continuation of the bullish recovery. Further upside could target the $1,250 zone.
If the deeply bearish trend reasserts itself and breaks below the noted $1,162 level, downside momentum could take the yellow metal’s price towards the 2014 low of $1,130. Further support will come from the $1,075 level.
The trade: Sell Gold at $1,183 with a stop loss at $1,195.50 and a take profit at $1,133. The Risk/Reward Ratio is 1: 4
Edward J. Moya
Senior Market Strategist
WorldWideMarkets Online Trading

