
Gold has continued to break records, climbing above $1,200 an ounce on the first day of December. Despite the Dubai-inspired post-Thanksgiving correction, in my view a top hasn’t arrived. The technical setup isn’t there, and I see $1,240 as the next near-term target.
Gold has been a favorite market of mine for many years, from the time Americans were actually allowed to own gold in the mid 1970s. Believe it or not, there was a time when that wasn’t the case. Once Americans could buy gold, the first bull market in the 70s was fantastic. This current bull market is also amazing, and it’s been well over seven years in running (with a few rough patches).
As we returned from the Thanksgiving holiday, we saw the risk that can be involved when news hits during times of relative illiquidity, when markets are open but participation is light. The day after the holiday this year saw some big market moves; hopefully didn’t make a turkey of your futures positions. The Dow Jones Industrial Average fell 1.5 percent on Friday, November 27, the S&P 500 fell 1.7 percent and gold fell 1.3 percent amid news of debt troubles in Dubai.
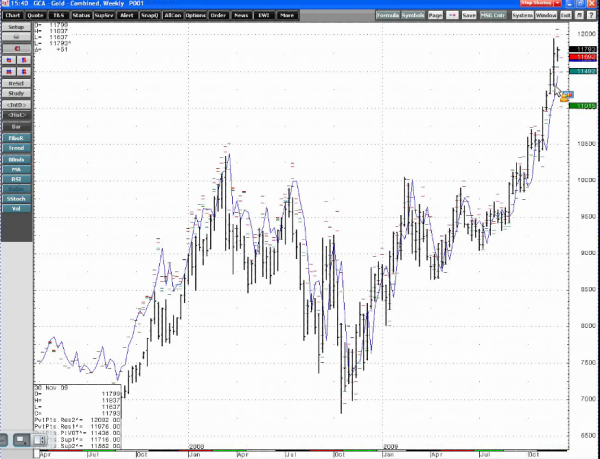
Looking at a weekly chart of gold, you can see the break didn’t create much damage. You can barely see the holiday break; gold still shows higher lows on a weekly basis. The equity in your account may have been damaged, but the technical picture wasn’t. The market had gotten ahead of trailing moving averages, so there was room for a correction.
Gold, Weekly
The problems snowballed out of Thursday’s trade resumption when February gold fell through $1,180, and hit a low of under $1,140 on November 27. The next trade day you would have to decide whether re-entry on the bullish side made sense at that time. A skill any good futures trader must cultivate is re-entry. Market conditions like this become important lessons. If you don’t use stops on your futures positions you’ll likely be in trouble. If you can’t climb back in when the squall clears, it will be difficult to be successful. I also recommend that you don’t use all the leverage futures markets allow. Put up at least double the minimum margin, to provide yourself a cushion.
The benefit of options (which can offer you defined risk) also becomes clear in this sort of environment. As long as a position has a reasonable amount of time, a speculator can ride out a big buckle like we had over the weekend. The strong, built-in risk advantages of options becomes clear in handling unexpected spikes in volatility that trigger snowballing stop levels in today’s 24 hour markets.
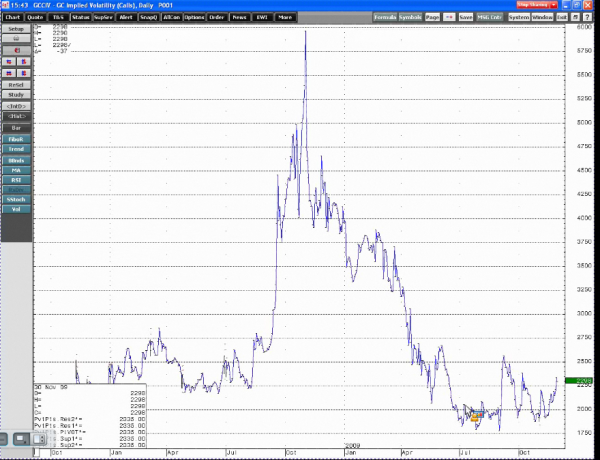
Volatility in the gold market is actually more subdued than you might expect. It’s down from the fourth-quarter of last year as well as the first quarter of this year, when the market plunged down to $700. It’s an enigma to me that volatility is so low. But it appears the deck has already been cleared underneath the market, and long side is still the place to play the market. There may be some unfinished buy stops above. If you do want to get involved in this market, a reasonable stop might be underneath the lows on Monday, November 30, near $1,165 in the February contract.
Gold Volatility
Gold seems to be the leader of this liquidity-driven bull market in other commodities as well. I’ve never seen grains so dictated by outside markets, particularly gold. The influence of commodity long-only funds is great. This factor seems to be trumping an economy stuck in a quagmire. Stocks seem to be able to float above, and likely will continue to do so with gold.
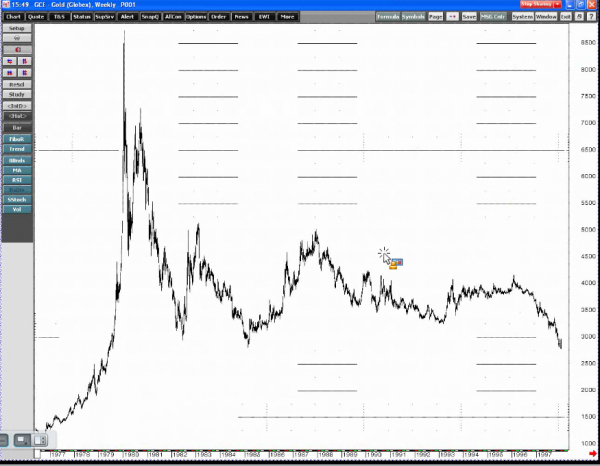
It’s possible recent heightened volatility in gold could prove the beginning of a reversal in trend, but I think the fundamentals remain intact for the bulls. Until political change in the U.S. signals a serious containment of entitlement spending, I don’t see much of a change in the current trend. If the bears can take out the post-Thanksgiving spike low, the picture could change. But do we have anything like the parabolic top in gold in the 1980s? I don’t think so—at least not yet. Take a look at that spike high and how it compares to the current chart. What do you think?
Gold Peak, 1980s
James Barrett is a Senior Market Strategist with Lind Plus, Lind-Waldock’s broker-assisted division. He can be reached at 866-419-7698 or via email at jbarrett@lind-waldock.com.
Past performance is not necessarily indicative of future trading results. Trading advice is based on information taken from trade and statistical services and other sources which Lind-Waldock believes are reliable. We do not guarantee that such information is accurate or complete and it should not be relied upon as such. Trading advice reflects our good faith judgment at a specific time and is subject to change without notice. There is no guarantee that the advice we give will result in profitable trades. All trading decisions will be made by the account holder.
You can hear market commentary from Lind-Waldock market strategists through our weekly Lind Plus Markets on the Move webinars, as well as online seminars on other topics of interest to traders. These interactive, live webinars are free to attend. Go to www.lind-waldock.com/events to sign up. Lind-Waldock also offers other educational resources to help your learn more about futures trading, including free simulated trading. Visit www.lind-waldock.com.
Futures trading involves substantial risk of loss and is not be suitable for all investors. © 2009 MF Global Ltd. All Rights Reserved. Futures Brokers, Commodity Brokers and Online Futures Trading. 141 West Jackson Boulevard, Suite 1400-A, Chicago, IL 60604.

