

Well it seems the risk, for the time being, out of Syria has been diminished which has helped calm the oil market. While Syria only accounts for approximately 0.2% of the global oil production, any threat out of the Middle East tends to cause the oil market to spike. So does the resolution in Syria mean we are in for lower prices? Let’s see what the charts say….
WATCHING MOMENTUM
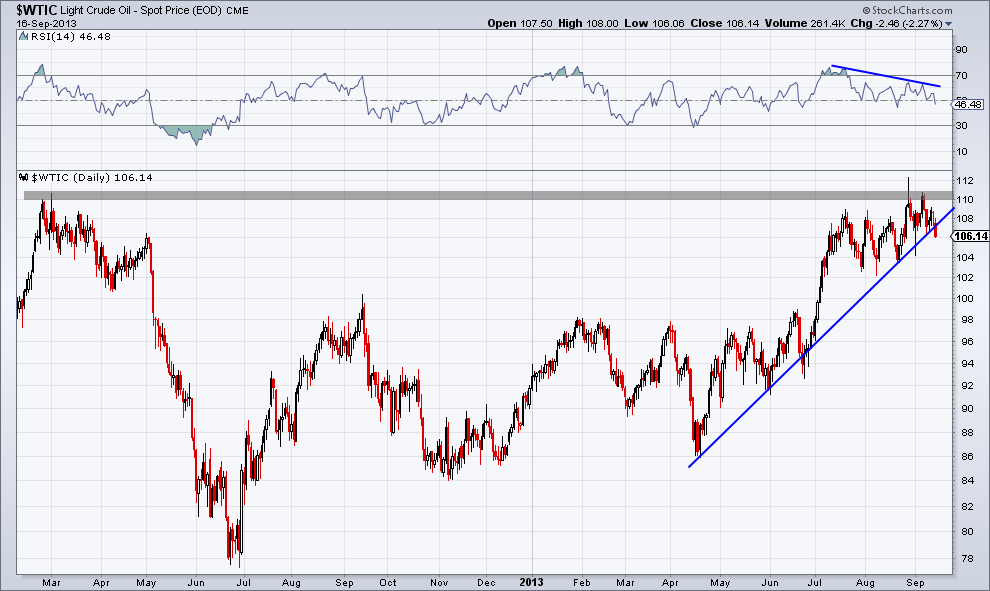
During the run up that began in in late-June I had been watching momentum, via the Relative Strength Index (RSI), find support at its 50 line. This was a bullish sign that buyers were stepping in on weakness to keep price elevated. When we first saw a break in momentum on August 22 I wrote on my blog that if we see a break of the 50-day moving average, which at the time was sitting just under $103/barrel then we could be in for some continued weakness. Well it didn’t happen as price held above its 50-day and we put in a higher high just over $110/barrel a few weeks later.
MAJOR RESISTANCE
As prices advanced we found ourselves testing the 2012 high in crude oil of around $110. When testing resistance (and support for that matter) I prefer to watch closing prices. While intraday trading is important and can shed light on what’s developing within price action, I believe the closing price holds more significance on breaks of resistance and support. Earlier this month we saw a close of $110.31 – setting a new short-term high and testing the 2012 high. With price advancing we began to see momentum weaken and divergence as the RSI indicator put in lower highs.
With Monday’s close we now have a break of the uptrend off the April ’12 low that crude oil used as support in June, August, and we saw a few touches in September. Monday’s price action also marked the first close under the 50-day moving average which many traders will find important.
THE BOTTOM LINE
To wrap it up, we have a failed test of resistance at a previous high, a weakening momentum indicator, and now a break of support as fear exits the market with regards to Syria. If oil prices continue to decline then I’ll be watching the August low as potential support around the 103.50 area. If traders are able to break below that, then it’s possible we see a march back to $100/barrel in the coming weeks…we’ll see where price takes us.
Disclaimer: The information contained in this article should not be construed as investment advice, research, or an offer to buy or sell securities. Everything written here is meant for educational and entertainment purposes only. I or my affiliates may hold positions in securities mentioned.

