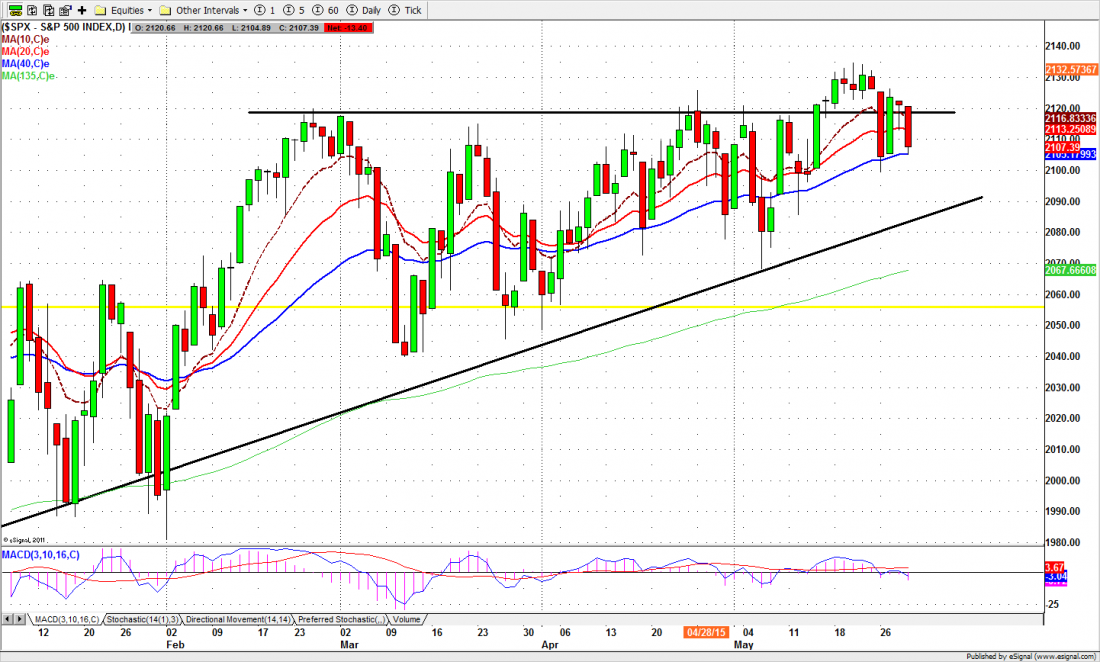
The S&P 500 cash index (SPX) closed at 2107.39 last Friday, the last trading day of May. The index was down 18.67 points for a net loss of 0.8% for the week, but a gain of 1.02% for the month.
The S&P5 00 is the large-cap index, and despite the small pullback last week it still managed to hold above the psychologically-important 2100 psychology support line.
That’s important, because last week there was a lot of room for things to go wrong. The economic data released during the week was awful, especially the revised numbers on Q1 GDP; it was a short week, so there was less time to work through some of the crummy data; and the uncertainty about the Fed’s intentions with respect to an interest rate hike is giving traders and institutional investors the vapours.
This is the first week of June, historically the worst month of the year for US equities. Average returns for June over multi-year periods are negative, and lot of traders will “sell in May and go away.”
History doesn’t always repeat, and this June might be different. On the long-term chart this is still a bull market, and the long-term trend is still intact.
But the short term is a different story. The SPX gave back the gain made in the pre-holiday week, and retreated back below the broken resistance level for the monthly close. Now we are watching the index options on the index for clues to the next direction.
And we are also watching Europe. There is a bank holiday in Greece on Monday – after signs of panic on Friday, the day pensions are deposited and quickly withdrawn – and a loan payment that cannot be met coming due on Friday. We have heard them cry wolf before; but maybe this time the beast really is at the door.
This Week
The SPX is up 35% since the break-out from the long-term double top pattern in 2013, and it is clear the long-term trend is still in place. And that’s the problem. The long-term and intermediate-term indicators are all overbought – not surprising, because the market has been advancing steadily for two full years (April 2013 to April 2015).
A consolidation or a sideways movement is overdue, and probably required in order for the index to continue the upside movement later. And June is the traditional time for corrections or consolidations to begin.
We think consolidation rather than correction, and we think it will be relatively modest – say a 3% stutter step, lasting anywhere from a month or so to the entire summer.
The SPX options are showing larger-than-usual volumes and an unusually large range of strikes being bought. That suggests fund managers and institutional investors are unsure about the next direction and are hedging heavily in both directions.
This will make it more difficult for the index to advance. At the same time we also should expect a wild whipsaw move for the short-term. The index can sell-off fast and quickly recover next day.
The yearly pivot (2055) will be a key line this month. We expect this pivot level area could hold up through the correction period, but a break below it could lead the index down into the bottom of the consolidation area or lower into major short-term support level. You can see the detailed price levels on our website.
ESM5
The S&P 500 mini futures (ES) at 2106 on Friday, which was pretty close to our predicted monthly closing price of 2105. We’re going to call that a win.
The 2090-89 zone will become an important level for today (Monday) and tomorrow. Whether or not this area holds the price up will directly determine the next short-term move.
A failure to hold up could drop the ES to or close to the 2065 area to test the 135-day moving average line. That line has held the ES up for the past seven months. The first intraday resistance area is 2119.25-18.50. As long as it holds ES down, 2095.50-96.50 (last week’s low) could be retested again. A further decline to 2094.50 to fill the gap left behind at that level is also possible.
The very short time-frame was oversold on last Friday, so we may see a bounce overnight, but this bounce should be a brief. Traders should focus on short side if there is a bounce up near the first resistance level 2119.25.
The major support levels: 2089-90.50, 2085-84, 2070.50-75.50, 2065-62.50;
the major resistance levels: 2134-36.50
To receive free market insights with actionable strategies from naturus.com, click here
Chart: S&P 500 cash index, May 29, 2015. Daily bars.