Congrats to the U.S. soccer team for last night’s win over Ghana. I hope you can pick up the pace when you meet Portugal on Sunday.
No doubt some of you out there rolled your eyes when you saw that headline. Commodities have been out of favor since peaking in April 2011 (as measured by iShares GSCI Commodity-Indexed Trust). But GSG has recently surmounted an important technical barrier, and reward versus risk looks attractive.
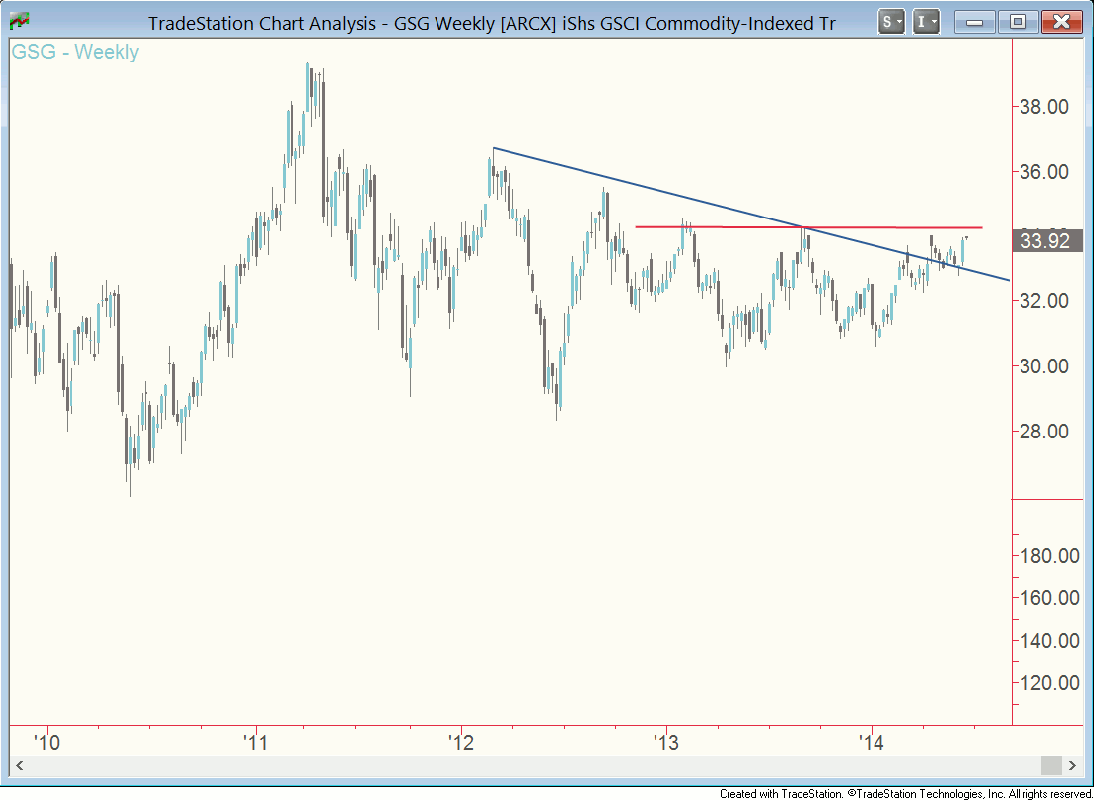
Nothing fancy here – just a weekly chart going back to 2010 with two lines on it. The blue one is a bearish trendline drawn off the March 2012 and August 2013 highs. As you can see, GSG rallied above that trendline in April. What I particularly like is that it then eased back for a spell but ultimately attracted buying last week, confirming prior technical resistance as support. There’s now a nice little base atop that trendline that favors more upside to come.

I’m now watching to see if GSG can take out chart resistance at 34.28 (red line). That would be a milestone by confirming a crowd willingness to buy above a ceiling that has turned the market back twice since early 2013.
From a reward-to-risk perspective, buying now is appealing. Placing a stop loss beneath last week’s low of 33.07 (the low of a tall bullish belt hold candle) translates to risk of less than 3%. That’s pretty modest, and you’d be buying closer to the base rather than waiting for the market to get away from you.
Good trading, everyone.


