

The J.M. Smucker Company is trading at all-time highs and is reporting earnings. So is poised to go higher? Or is time to fade this party?
The chart analysis is very clear on this and here are the important zones to be aware of as SJM releases its earnings pre-market on 6/4/2015.
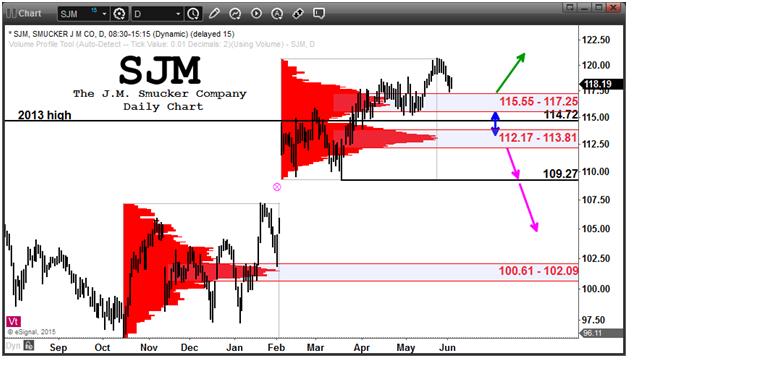
Both the near-term and big picture bias is pointed higher and in a position of strength. Key support is at 115.55 – 117.25 and any dip into this zone is buying opportunity. Only a breach of 115.55 would negate this outlook.
If 115.55 is violated to downside, the positive outlook would shift and the next robust level of support is 112.17 – 113.81. A noteworthy level on the way to this lower zone of support is 114.72, which until recently was the all-time high set in 2013. Any decline that tests this lower zone of support will have resistance to contend with on a subsequent rally attempt at 115.55 – 117.25.
Any scenario where there is a breach of 112.17 would be a substantial negative for SJM and target 109.27 or lower.
Volume‐at‐price is valuable tool similar in some ways to Market Profile, which utilizes time‐at‐price. Volume‐at‐price is displayed as a histogram along the price (vertical) scale and builds across the chart as traded volume occurs at each price. This view is sometimes referred to as a volume profile or volume‐at-price.
Volume‐at‐price analysis provides valuable information about what prices have seen the heaviest institutional interest and can give insight into where the smart money is accumulating and distributing. While traditional indicators are often simply derivations of price information, volume‐at‐price provides unique additional information that is not available to traders only using traditional technical analysis methods.
If you are interested in learning the value of volume-at-price information, check out www.VolumeAtPrice.com

