The bullish charts for me are currently located in Materials, Constructions, Food, Energy, Drugs, Marine Shipping, Telecummunications and specially in Diversified Services.
Having said that it is in fact very unique and very few selection of charts only which passes throw at all and I think the numbers are getting smaller & more difficult to find new cases but on the other hand I am very early bird to leave them also, usually. Manitocow and Double Eagle energy charts also showed that once again for me…same story as as BAS, FTK, DAKT……keeps just going further and further.
Currently I have only 65 long positions which is seriously down from january positions, one reason for that is also re-rotation.
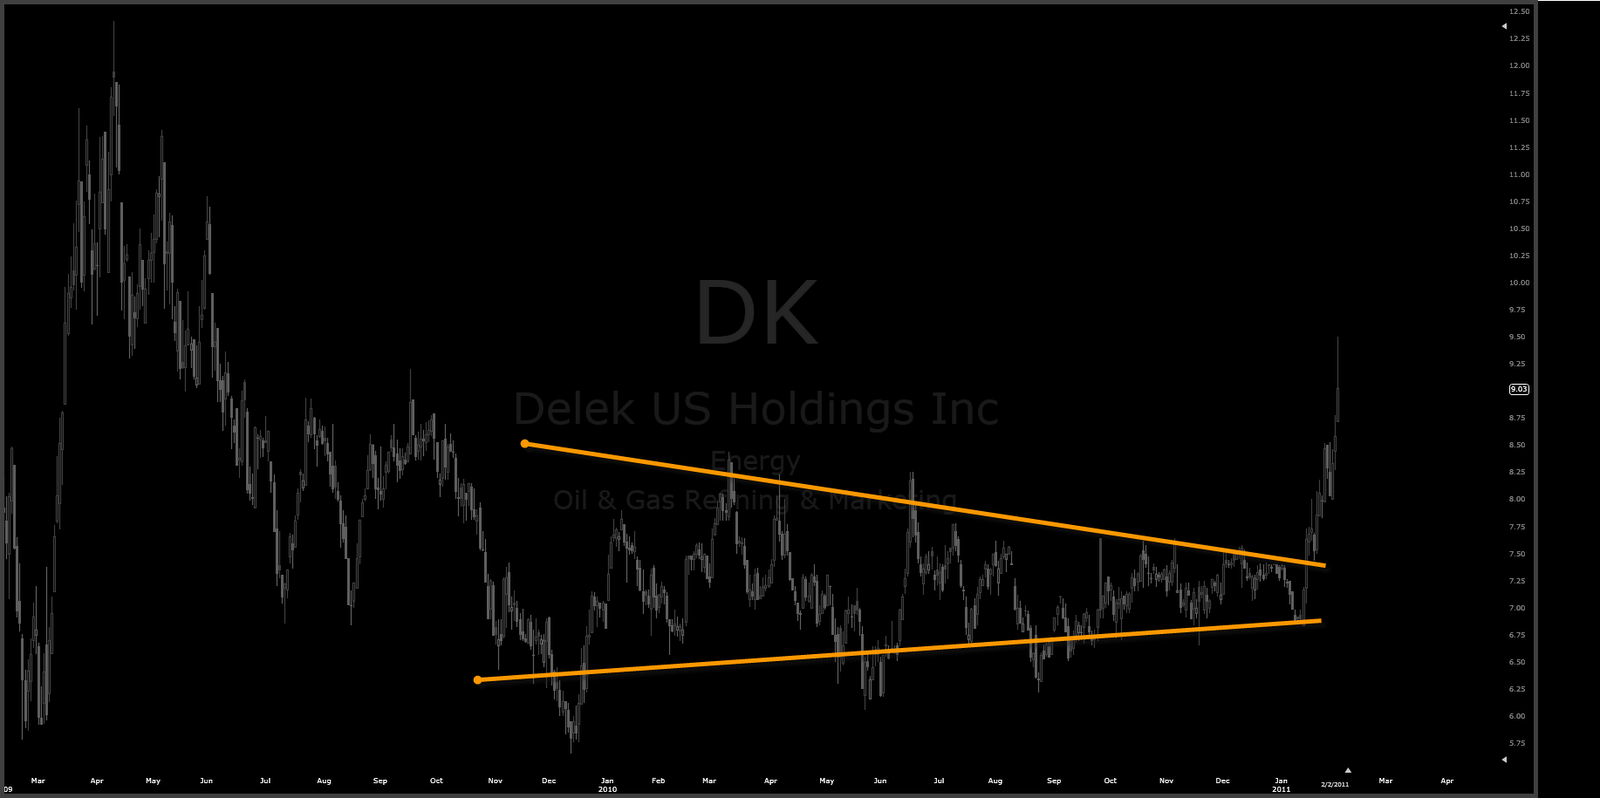
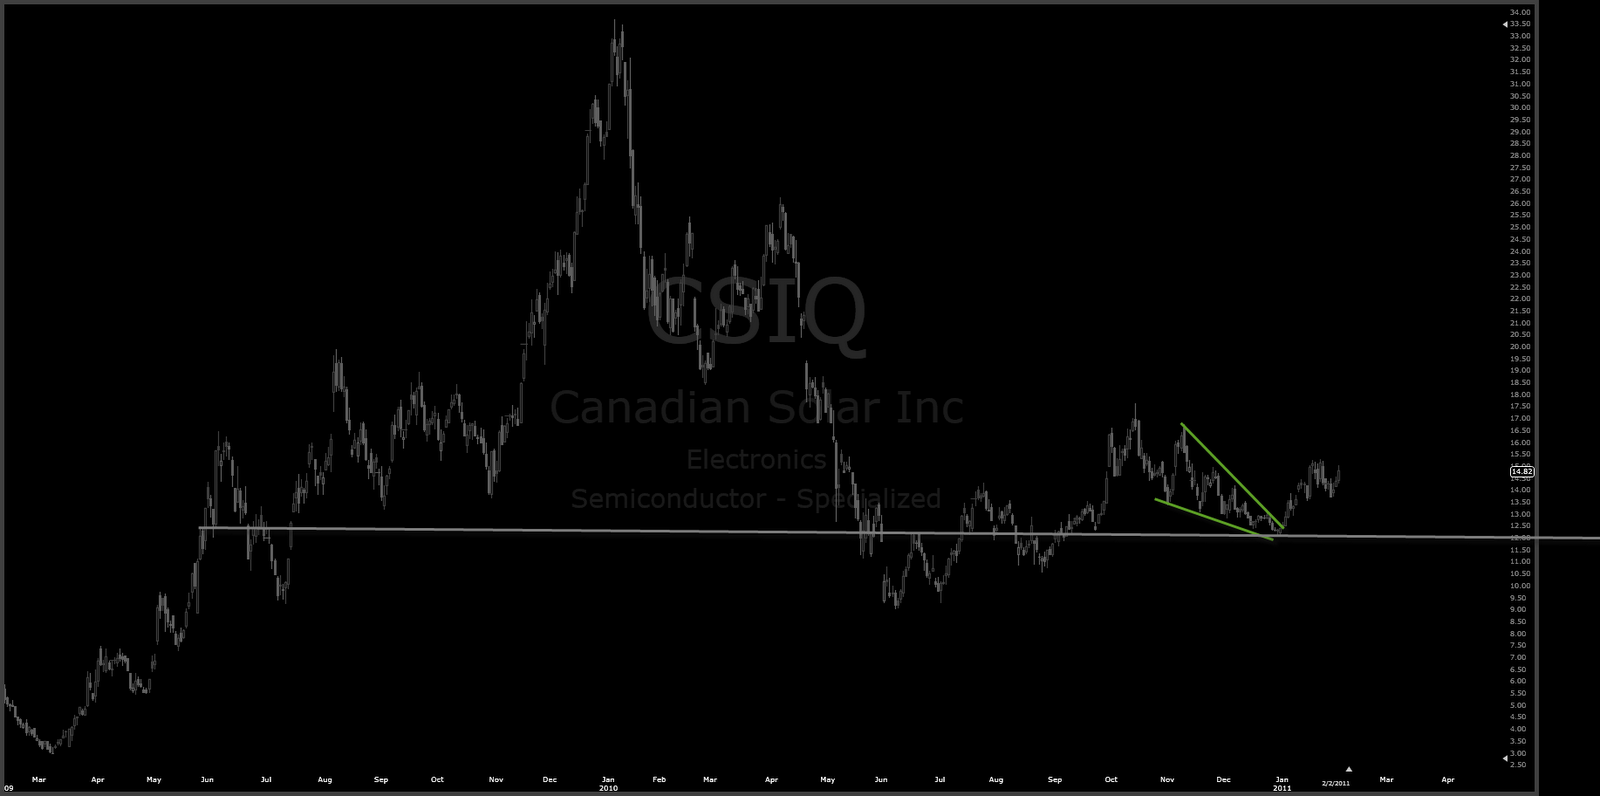
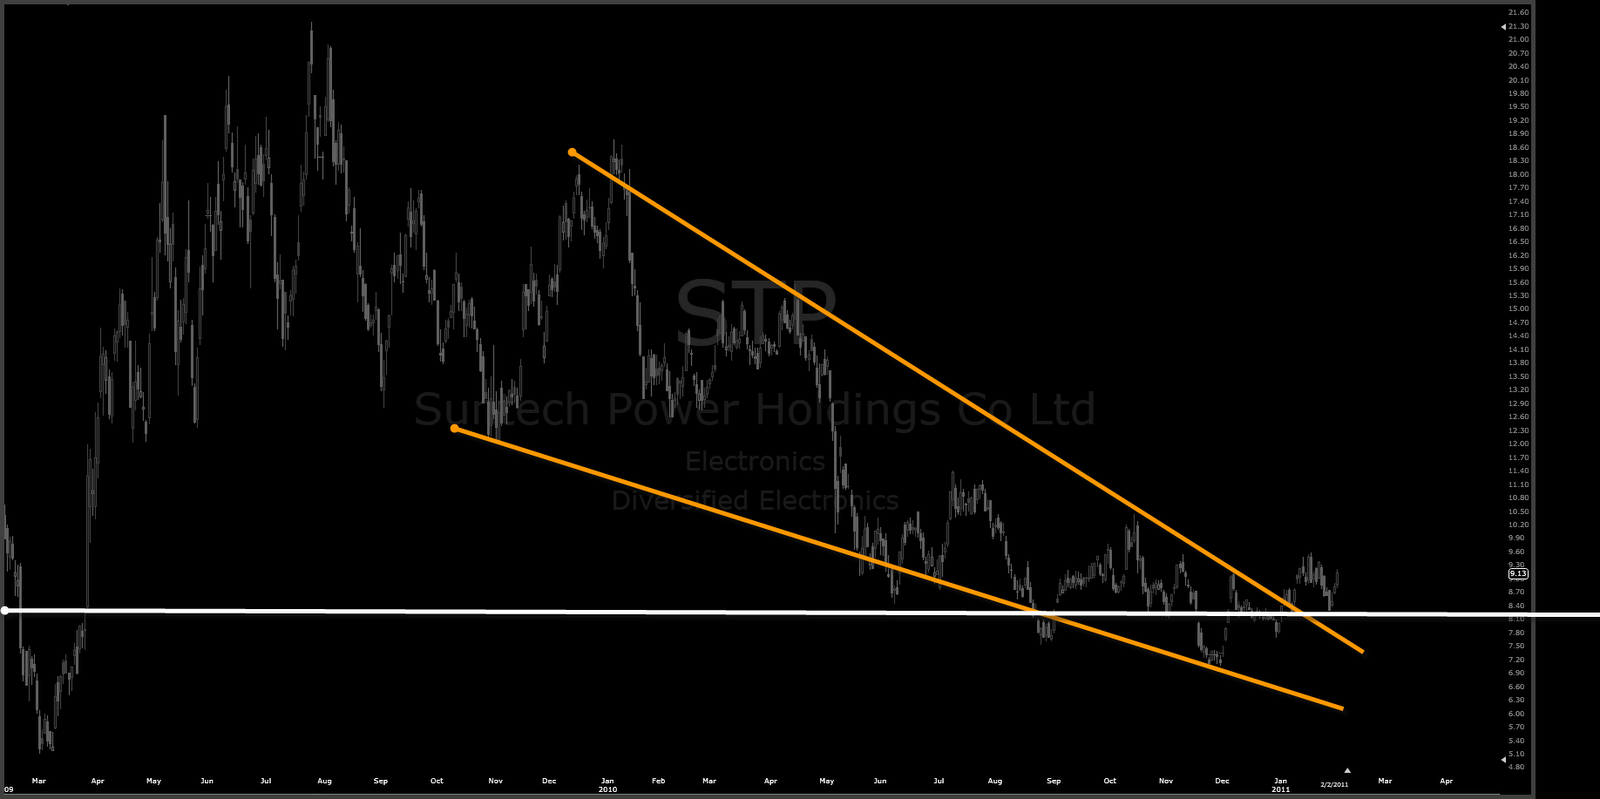
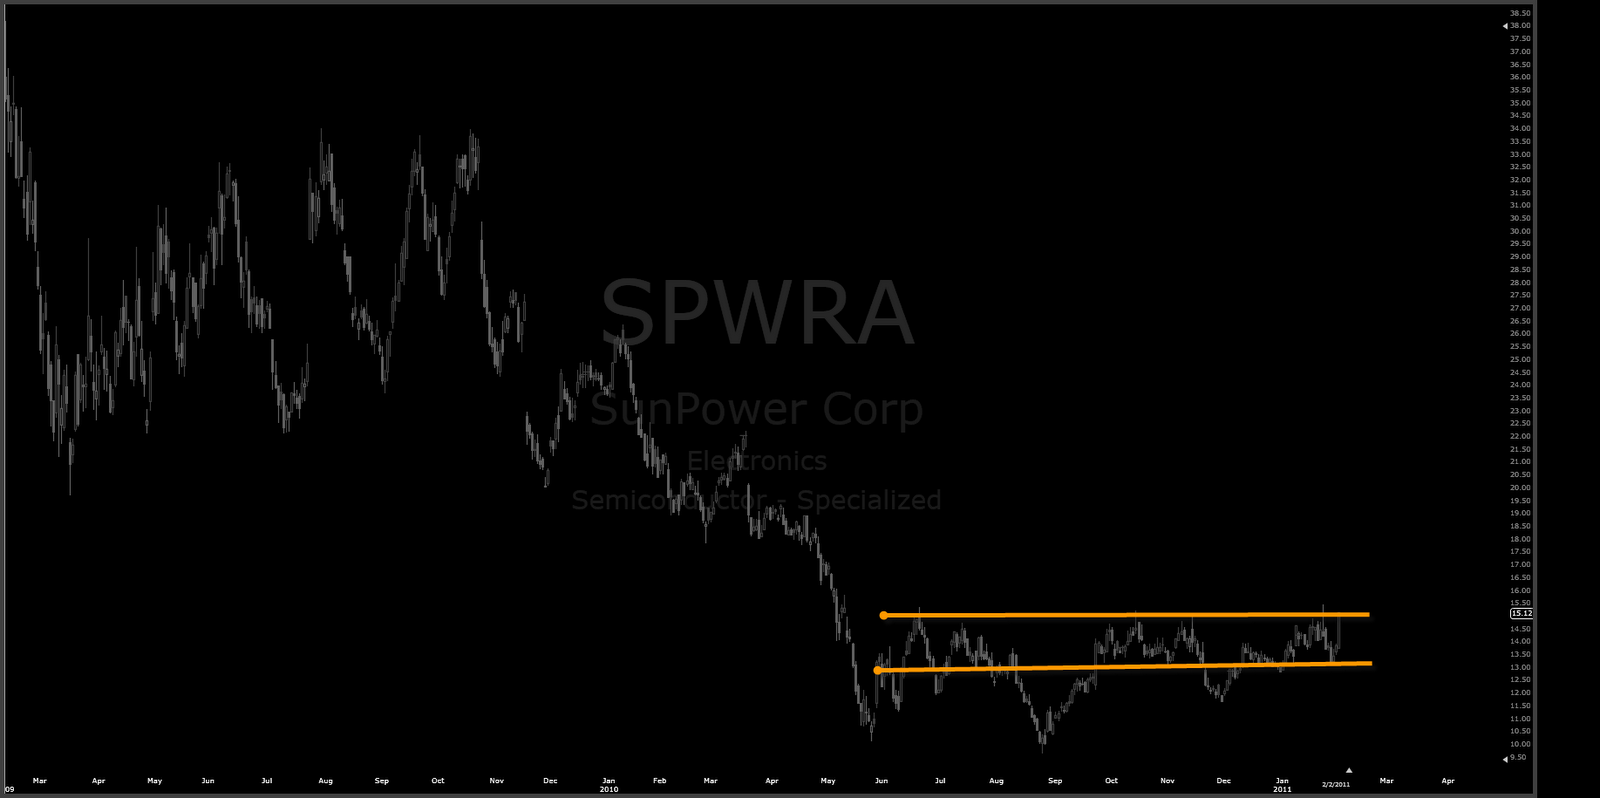
Here are 4 energy and solar charts for which I do have positions also.
I am bullish for both, Indurstrial Production from December and Service Sector ISM with selection of charts or actually I am bullish with service sector ISM because of charts is better description.
Tomorrow will exit my ALJ, it starts to reach now +100% and that might happen tomorrow. Likely it is also going to follow DBLE + the rest path and goes more further.
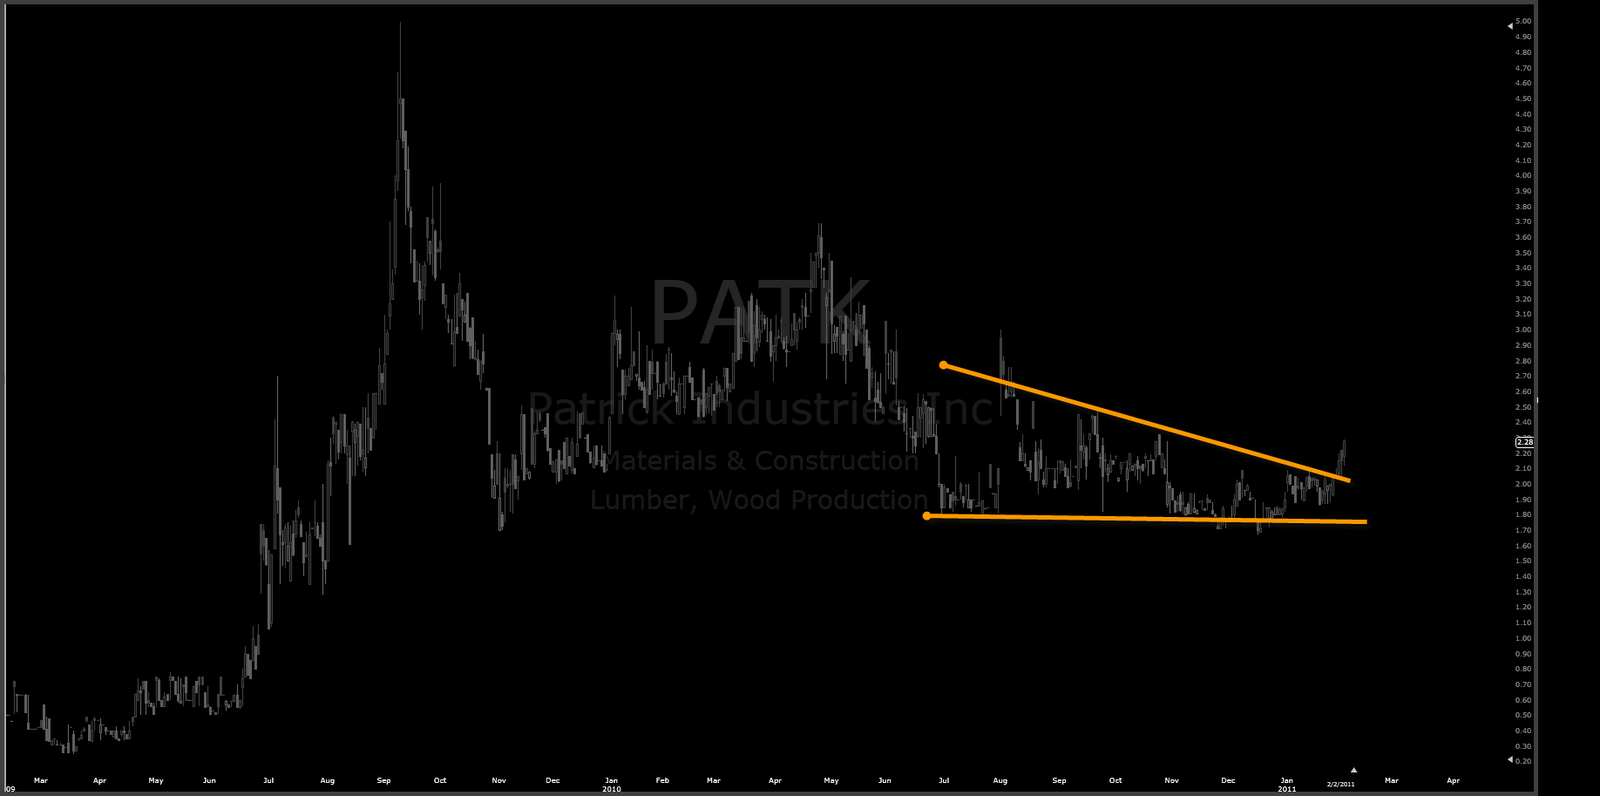
PATK, IESC, HYGS, GCI, OCLS are some new longs.
If it all sounds too bullish keep in mind that 85 – 95% of stocks in this entire market do not pass throw access gates anymore for long side drive in here for me, but I also take only potential bottoms or at least very close so actual running impulse charts won´t interest me much anyway.
No waves at this time, just EW contracting power pattern charts: