If you have been trading for some time, you have probably heard: “The trend is your friend.” And if you are an active investor, the trend has been your best friend, at least for the last three years or so.
Here’s the thing. One of the most important things about trading is knowing how to read charts, and, of course, knowing how to read a trend, especially a change in the trend. By knowing how to identify trends you are able to spot trading opportunities, which gives you an edge in knowing when you need to be aggressive and when to have a more laid back approach. You will be able to spot trading opportunities ahead of other traders.
Reading trends is in strict correlation with time frames. When analyzing swing and position trades, we refer to long-term time frames (the daily, weekly and monthly chart), as they dominate the present move. For intraday traders, the value of trends comes from smaller time-frame charts (from 1 minute all the way to the 60 minute chart).
A stock, commodity, forex pair, an ETF, etc. can be in a strong up trend on the large time frame and into a down trend on a small time frame. It is also good to remember that the longer trend is always the one dictating.
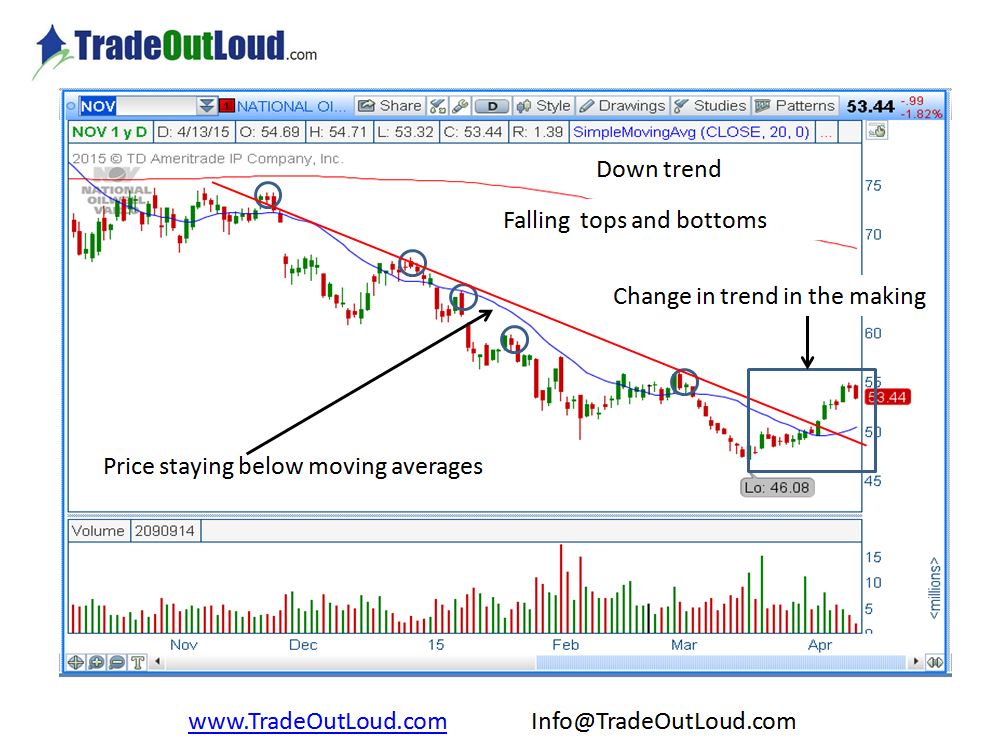
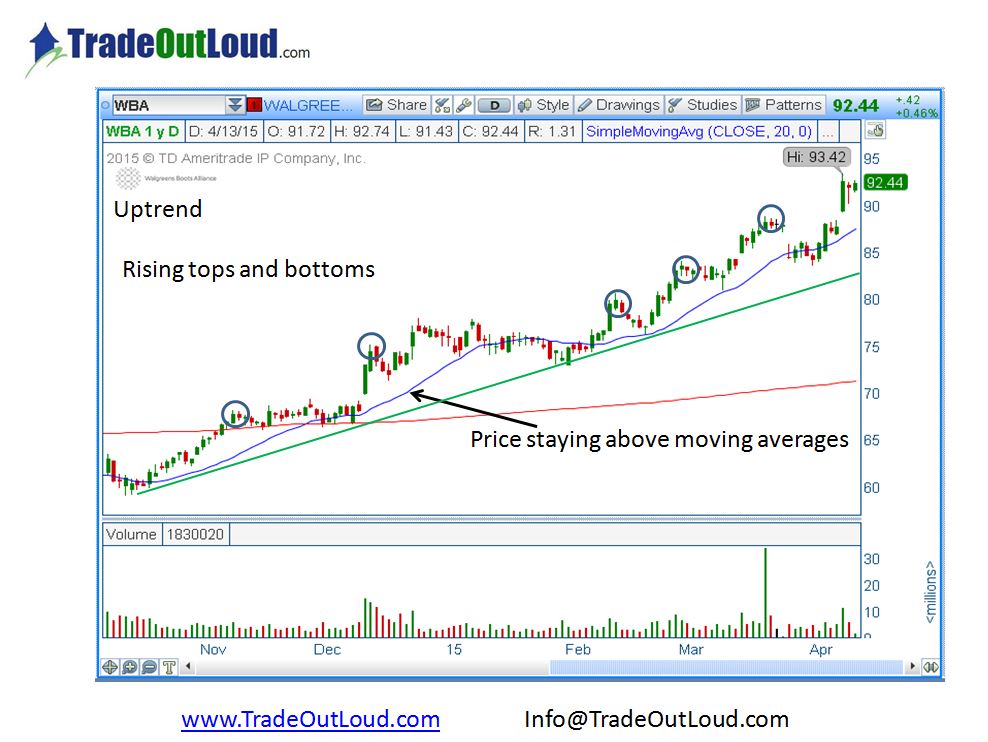
There are different ways in which one can determine whether a stock is into an uptrend or downtrend. If the stock has a succession of higher highs and higher lows then the stock is into an uptrend, and if the stock has a succession of lower lows and lower highs, it is in a downtrend. One thing that you need to remember is that a stock has to start with at least two lower highs and two lower lows for downtrends and at least two higher highs and two higher lows for uptrend.
For beginner traders, is it easier to have simple moving averages (SMA) added to charts, and as the price moves higher, the SMA will move along with price, and it will be much easier to see that the price is trending. As long as the price resides above the moving average, the stock is in an uptrend, and when it gets below, it is a sign that it is not trending up, and it can start a correction or a downtrend.
Trending Stock Examples
Up Trend
Down Trend