
From time to time I have been known to make a “good call”
While the events in the last 3 days are very sad day for the world, they fit into the cycle of things and fit very well the public forecast I made on March 1, 2011. See my chart inserted below.
For those of you who persist in trying to put events before the markets, I feel you are doomed to failure since the markets will always be leading the way. You will be left reacting. This is the basis of priced based analysis, that all trading is emotional not rational as our egotistic economist friends would have everyone believes. The swinging of the pendulum is always proportionate and it always weaves its way from one extreme to the other.
In terms of similar points in history where I would draw a parallel to the last time Mother Nature had such a “clustering” of earthquakes, 105 years ago. It too was a bull market year in the face of a stagnant inflationary economy. The market rushed to sell the market based on the emotional upheaval the event caused. But to no avail the bull market could not be stopped and the bulls worked prices higher for the year. The correct rational was in 1906 that San Francisco would be rebuilt. Therefore all the economic activity from the rebuilding of San Francisco would be good for the economy. The bull market in stocks was the leading indicator.
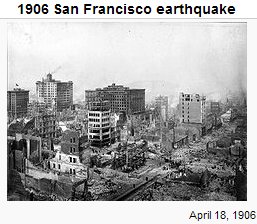
I feel strongly that the rational will be the same in the face of the disaster we all witnessed over the week end in Japan. However, it is more than just the 9 pt quake in Japan, it is the clustering of natural disasters throughout the world in the last 12 months or so that is one of primary causes of the economic rebound Along with QE and the massive stimulus package, the economy is likely to see some rapid growth. With all the massive spending to rebuild in China, Chile, Australia and Japan, the world economy will continue to recover from the WFC. . The bull market in stocks is the leading indicator of this. Our MarketMap2011 expects the bull market to continue through until year’s end.
The short term cycles I pointed out in my public comments on the LinkedIn, Face Book and Twitter channels are right on the money. I do not post meaningless crap day in day out. There is a difference between analysis and internet marketing. It is not my intent to put more noise on the street in the face of an already disconcerted public. Further, with the rash of all the newly unemployed from the WFC leaving Wall Street to become main street financial advisors, mom and pop money managers and the new twitter gurus, I only publish when it is meaningful and what is worthy.
Here is a tip, looking for an experienced financial professional? If they have one of the new 866 tool free number, he is a Jonnie come lately and you may want to find someone with more experience. You likely have a son or daughter older then him.
Chances are they don’t even know when the 1987 crash was and what caused it. If you must deal with them, look at them real hard.
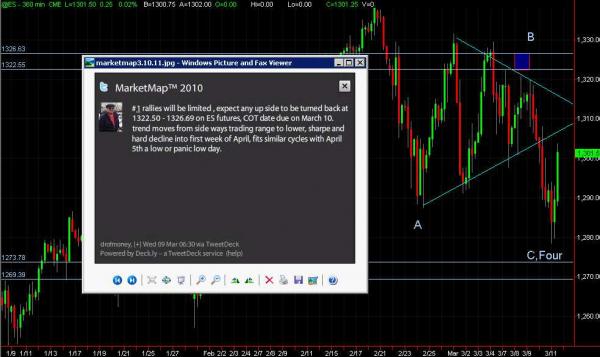
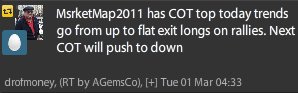
Back to the markets, the call was for a change of trend (COT) top on March 1, from up to sideways and on the March the 9th the COT from sideways to lower. From that date the trend lower was expected to pick up speed into the next COT the first few days of April before the bull market would resume. (Excuse the typo, its MarketMap2011).
For you Elliot wave followers, and man don’t you just love EWT, it almost gives you a sense that there is a mystical order of things underlying the market that make it ebb and flow just based on some kind of social cultural mentality or mood that is cyclical in its being and explains the universe and the meaning of life.
Well at best, but in real time EWT is only a little better than a pair of moving averages crossing over in that they can always be back fitted to match the current state of affairs and the moving averages are better as they give clear buy and sell signals.
With that said even a blind squirrel finds a nut once in a while and in this case it found a bearish “B” wave triangle. Making the declines coming out of the March 10 peak “Post Triangle” (PT) and least you forget, these trends are a terminal move. So this decline is the end not the correction that began February 22 not the beginning of a larger down trend. As you can see in the picture, the rebounds last Friday was from first support. While a low could be in place, we doubt it. Rather a wave one and two are now on place and the hard fall wave 3 just in front of you. Given the background news events – which by the way are very typical of an apex and post triangle moments – the trend now has its excuse to finish, right into our COT date April 5, 2011.
If you are still looking for event rationalizations in your investment strategies how about this: the world’s third largest economy has 1/3 of its energy supplies off line. What does that do for the demand for other energy sources in Japan? With all the other natural disasters in the past year to 18 months there is enormous pressure just not on the supply side of the equation but the demand side of the scale.
Which brings me to the notion of trends? This whole commodity based bull market trend began years ago with few of us noticing. It’s not hard to miss when, as Jimmy Rodgers says “The Government is lying when it said commodity prices are under control! If inflation is no worry Mr. Bernanke, why did the French PM making it public enemy #1?
No one likes commodities; somehow commodities are a dirty word, the root of all-evil. Along with labor cost they are the components that make up inflation, cost of living, which is the economic malaise undermining our future financial prosperity. This is at least according to the country’s bankers that “printall the money.
Back in May 2006, 5 years ago, I published a news brief head lined: “FOOD and Other Trading Opportunities.” It forecast that the bull market in commodity prices was far from over and for a few good reasons. The biggest one is that no one was seeing it; the bull meekness had not yet become “democratized bravado. In other words all the punters, the two bit speculators – had not been pulled into the gold and commodity markets like they had been pulled into the real estate bubble and the dot com bubble among others just in time to see them bust.
Today – 5 years latter – we are not seeing the signs of broad based public participation in these markets and just the early signs of the business news media beating the inflationary drum. Until we do, the trend will continue. What about the events you say, what if they stop?
For one the demand and supply imbalances that are now put into motion today will not be pushed back by a few up ticks in the prime lending rate. Furthermore, the events lag the market. No it’s not voodoo, it’s the way cycles are. For those of you who would like to learn more about cycles, we invite you to join up at the “Foundation for the Study of Cycles.” Yep it’s free! http://foundationforthestudyofcycles.org/
Are we close to the commodity bull market’s end? With a big bang 9 point quack just offshore HonShu Japan it the can certainly be leading edge to a major top. Major events can be coincidental to major turns or preceding it by a span of time like 9/11. However, with the supply and demand imbalances this cluster of disasters has created, the bull market in commodities is higher for the year 2011. This rising tide will float most assets including stocks. Which leave me with two last bits? During this decline look for the cream to rise to the top. It is the leadership in the market and where you should put your risk capital.
Great and Many Thanks,
Jack F. Cahn, CMT
TraderAssist®
Since 1989, Creative Breakthrough, Inc. CTA
Copyright 1989-2010
Skype me today at “traderassist”
Twitter Channel: drofmoney
FaceBook Channel: jfc@traderassist.com
LinkedIn Channel: jack cahn
Old Fashion Toll Free call 800-618-3820
U.S. Office: 7500 West Lake Mead Blvd.
Suite 9-151, Las Vegas, NV
89128.
Phone: 561-622-1936

