In an article published last week “George Lindsay and the Standard Time Spans,” I discussed this very unique method of Lindsay’s which points to an end to the bull market in U.S. stocks no later than October 9, 2012.
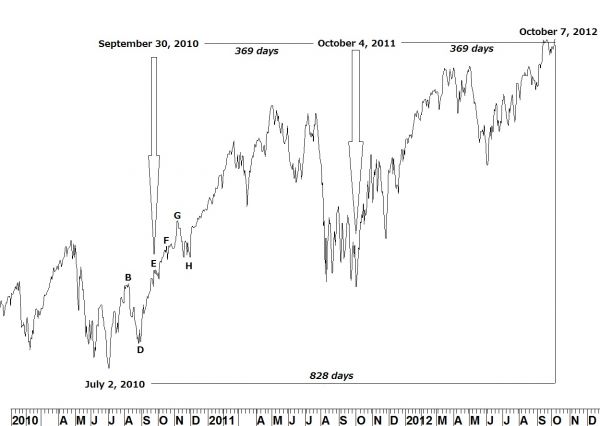
Using Lindsay’s methods, the time span in which to expect an end to the bull market was narrowed down to a range of 742 – 830 days from the low of July 2, 2010. Day 830 is on Tuesday of this week.
A LITTLE BACKGROUND
While Lindsay is relatively unknown today, during the 1960s and 1970s he was well-known for his ability to target market highs and lows to within a far narrower interval of time than the 90-day window given by a standard time span. That was done by first narrowing down the target for a top or bottom using the standard time spans (and long-term intervals) but finished by using his middle section counts.
THE RATE OF ASCENT SLOWS
A middle section is essentially the time during a bull market when the rate of ascent slows. To target the top of a bull market the count is made from point E, the second-to-the-last rally in the middle section, to an important low. Lindsay would then count an “equidistance” to a point in the future. When that point in the future fit into his other methods and models, the odds were good that a market top would be seen there.
TOP TO THE BULL
A small ascending middle section occurred between August and November 2010. Point E on September 30 counts 369 days to the low on October 4, 2011. Counting forward other 369 days points to a high on Sunday, October 7 and falls within the time span outlined by a long basic advance counted from the July 2, 2010 low. I would say either the previous Friday, or following Monday, are good candidates for a top to the March 2009 bull market.
[Editor’s note: Not familiar with Lindsay’s work? Ask Ed a question below. He’s the modern guru on this type of analysis.]
= = =