

Similar to forecasting highs, the first step in forecasting a low is in applying Lindsay’s 12y interval. The 12y interval stretches 12y, 2m–12y, 8m from an important high.
The next 12y interval is counted from the high in 2004 and points to a low in Apr-Oct 2016.
A decline which begins in the first half of this year will have time to fit Lindsay’s rule of thumb which calls for 1yr down followed by 2yrs up; a low in 2016 followed by a high at point J in 2018.
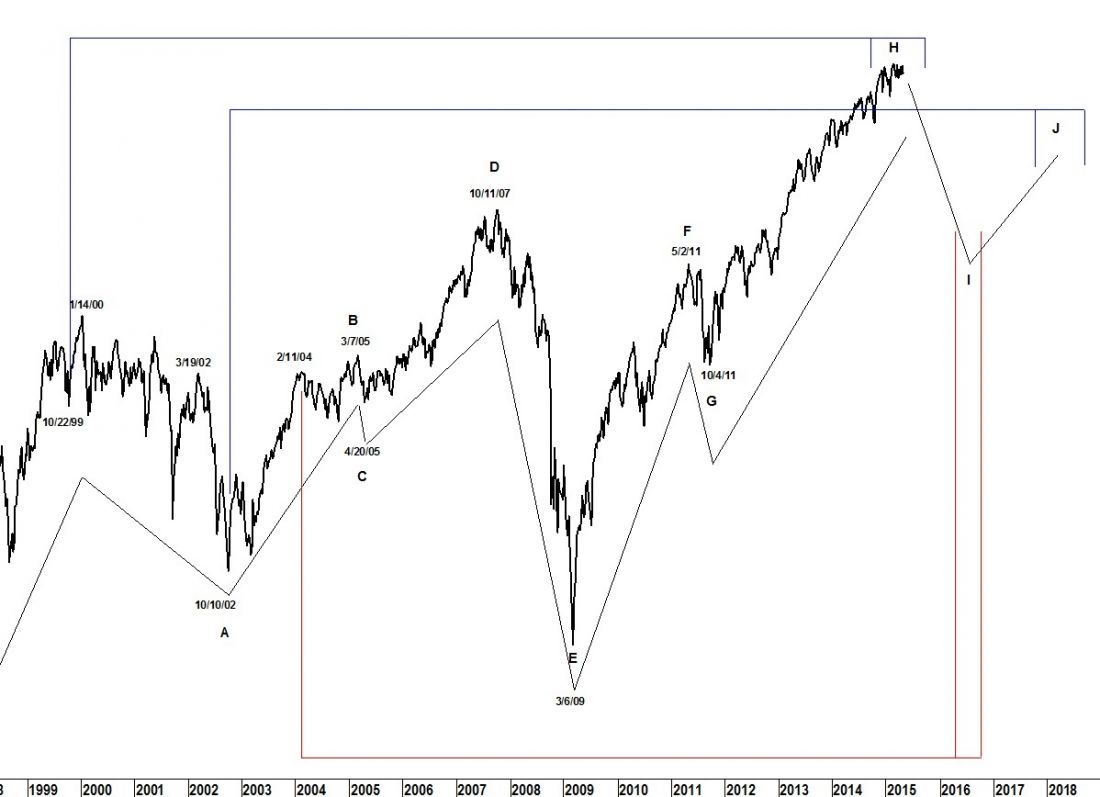
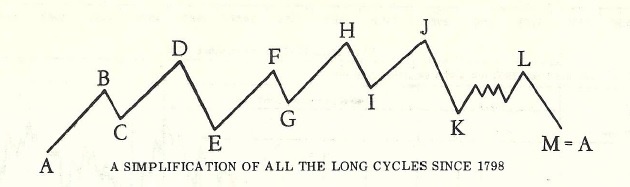
Point J can be higher or lower than point H. If the pattern of alternating long cycles continues (bear, bull, bear bull) the 2002 cycle should see a lower point J.
The end of the long cycle (point A/M) should be roughly 12 years from point D. It forecasts a low in late 2019 or early 2020.
Get your copy of the May Lindsay Report at SeattleTA.
Related Reading:

