

The first step in forecasting an important high is accomplished using Lindsay’s 15yr interval. It isolates an eleven month period in which the high is found. Lindsay wrote that the interval (15yr-15yr, 11m) can be counted from any “important” low leaving the identification of the low somewhat ambiguous.
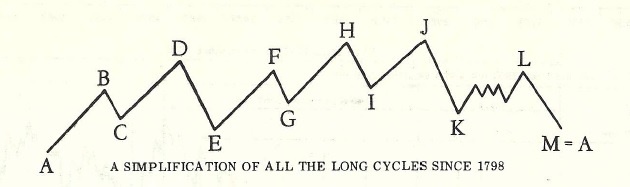
In my own attempt to derive a more structured approach to identifying “important” lows I found that most successful intervals have their origins at either a labeled point on Lindsay’s long cycle (points A, C, E, G, I, and K)or the low of a Separating Decline in a Three Peaks/Domed House pattern. However, most does not mean always and that is the situation we find ourselves in presently.
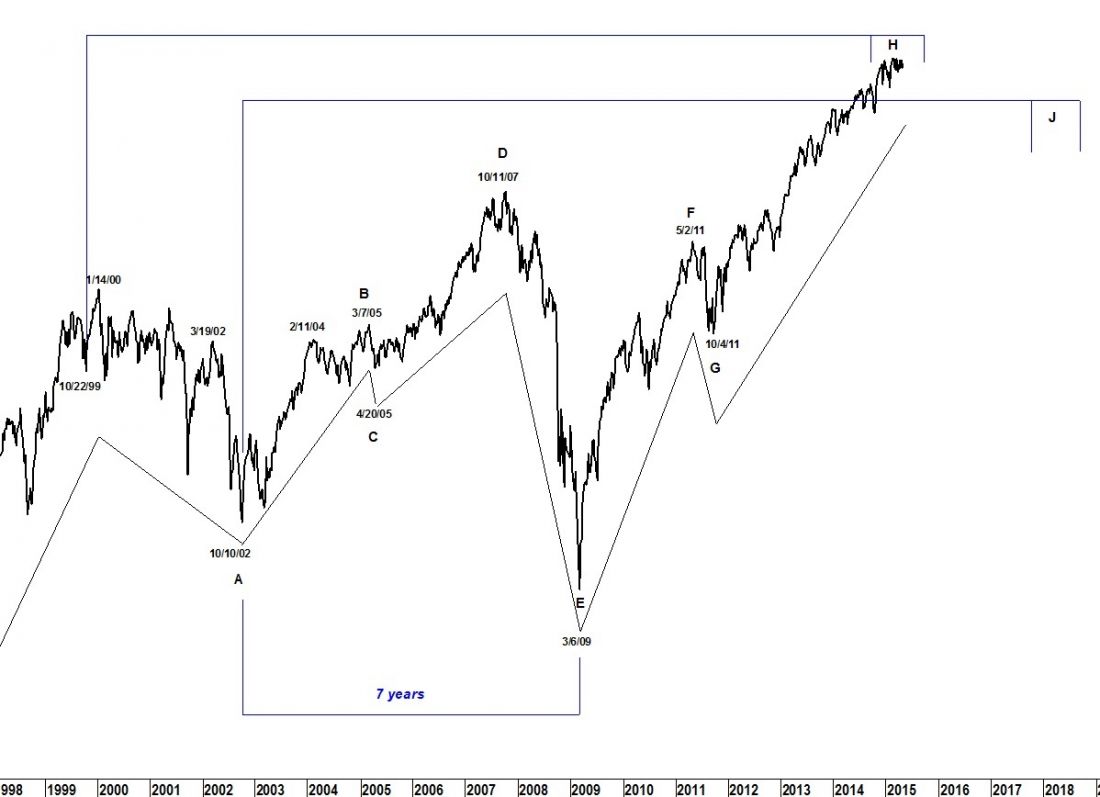
The final low before the bull market top in 2000 was in Oct 1999. It counts (15yr-15yr, 11m) to a high in the period Oct 2014-Sept 2015.
The next 15y interval is counted from the low in 2002. It forecasts a high in the period from Oct 2017-Sept 2018. Lindsay did write that the period between points D and A is roughly 12yrs, A to E is 7yrs, and A to J is 15yrs. A high in 2018 matches expectations for point J to be 15yrs beyond point A (10/10/02). Point J need not be higher than point H.
###
Get your copy of the May Lindsay Report at SeattleTA.
Related Reading:

