

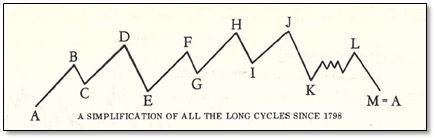
If the Dow December high was point H of Lindsay’s long cycle (approximately 20 years) as suspected, then we can examine past December lines from H to I to get an idea as to how low this December line will go. Unfortunately, with only four previous long cycles to examine (since 1921), the sample size is less than “significant”.
The average December line from H to I is 23%. The smallest December line was 10% (1990) and the largest was 45% (1973-74).
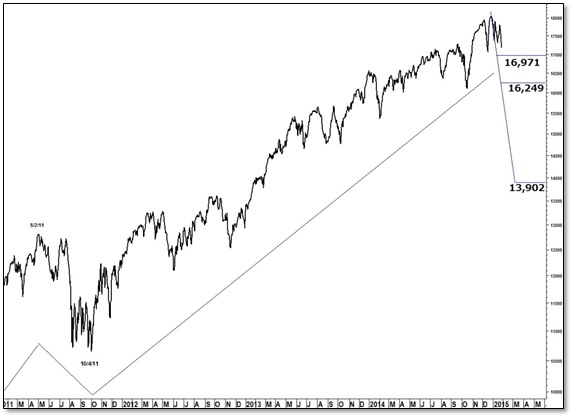
If the Dow falls 10% from the December high point, the low will occur near 16,249. If the Dow falls 23% from the December high point, it will occur near 13,902.
Expanding our search to include the December lines from B to C, F to G, and J to K (D-E and L-M are excluded, as they are the terminal December lines of multiple cycles and expected to be abnormally large),the average December line is 21% and the smallest December line is 6%. If the Dow falls 6% from the December high point, the low will occur near 16,971.
Reminder.
This analysis is only helpful if the October low was not point I. The Dow fell 6.7% during Sept-Oct, 2014.
October 2014
#####
Try a “sneak-peek” at Seattle Technical Advisors.com

