

George Lindsay’s model, Three Peaks and a Domed House, has a fantastic track record of calling bull market tops for over 100 years–often to the exact date and usually to within three days.
The ability to create such an exact forecast requires the integration of Lindsay’s other models. However, the attraction of the 3PDh model is that just by being acquainted with the basic form and a few simple guidelines the user can become alerted to a pending top in a bull market several months in advance.
FIND THE PEAKS
The first step in identifying the formation is labeling the three peaks and the ensuing deep decline Lindsay called the “separating decline.” During the separating decline the market must reach a level which is lower than at least one of the reactions following peaks one or two.The sell-off is followed by a period of base-building called, appropriately, the “base.”
We’re looking for an interval (roughly seven months and ten days [222 days]) from either the bottom of the base or the separating decline to the top of the bull market. Typically, a base is horizontal and we count from the second test of the low in the base. When a horizontal base fails to occur we must determine whether we are dealing with a descending base (lower highs and lows) or an ascending base (higher highs and lows.)
A descending base implies a longer than normal domed house which forces us to take our count from the “first floor roof.” An ascending base implies a shorter than normal domed house which inclines us to take our count from the bottom of the separating decline. If the August-September base was horizontal, it certainly wasn’t symmetric. But, was it descending or ascending? Perhaps it was what Lindsay called an irregular base.
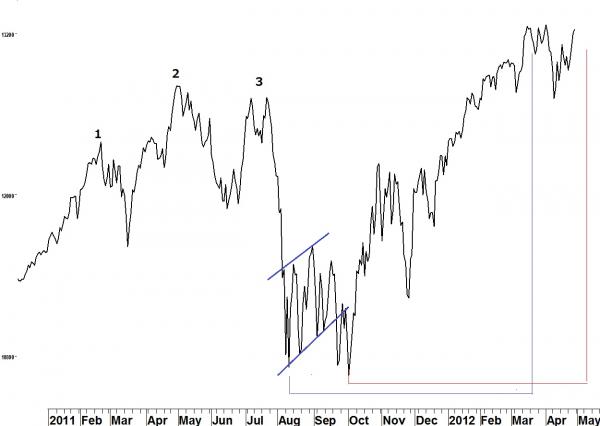
In Figure 1,the blue parallel lines outline a possible ascending base. To have the Dow then reach a lower low (October 4, 2012) once the base is complete would be unusual but not impossible. Counting from the bottom of the separating decline on August 10, 2011 forecasts a top on March 20, 2012. That would have left us wondering if March 15, 2012 had seen the high of the market. After the double-top on April 2, 2012 (227 days from the bottom on August 19) we still would have been thinking “double-top.”
TOP HAS FORMED
The 2011 base doesn’t lend itself to being called descending so the only possibility left for us is that of an irregular horizontal base. In this case, the count is typically taken from the second test of the base or final low before the ensuing first floor wall (an abrupt, almost vertical, move upward in price).
Bottom line? I believe the top was seen (in the Dow) on May 1.
[Editor’s note: What do you think? Do you think U.S. equities have put in a major top? We’d like to hear your thoughts.]

