The sharp sell-off in the stock indices and the sharp spike in VIX spells trouble ahead.
This sell-off in the SPX accompanied by a spike in the VIX has come after a lengthy period of low VIX readings just like in late 2007. In that instance, the initial spikes in the VIX above 24 were an early warning to the price damage that was to follow.
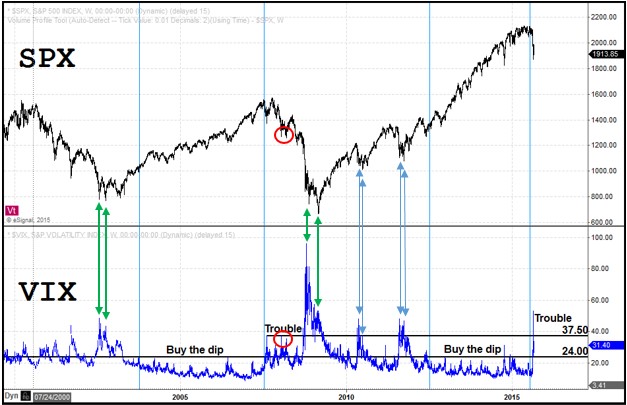
Looking at the chart below, I don’t believe the recent decline is just another ‘buy the dip’ opportunity. I have the view that the market has transitioned away from a bullish phase and is beginning a bearish phase.
If you look carefully at the lows of 2002 and 2009, which came after a bear phase, each of them showed a lower low in the SPX while the VIX did not make a higher high.
Additionally, after the final low in 2009, the higher lows in 2010 and 2011, all showed this same behavior. This type of behavior marked the lows until the VIX had once again settled back into a phase of being consistently below 24 and the ‘buy the dip’ mentality had again taken hold.
So eventually this type of divergence is something that I will be looking for. But be careful about looking for this too early… look at the red circles on the chart.
If you’d like to learn more about how to read the stock market, click here.