First, let me emphasize that you do not need to be able to construct your own point and figure charts (click here instead), nor do you even need to be able to read one. If you are reading this guide, you have enough knowledge to be successful.
Second, there is, to my knowledge, no simpler way to locate support and resistance than with point and figure charts. The ease with which it can be done will astound you. Because of the simplicity inherent in the point and figure chart’s structure, creating successful entry and exit points will become a snap, enabling you to reduce your loses while increasing, not only your profits, but your confidence as well.
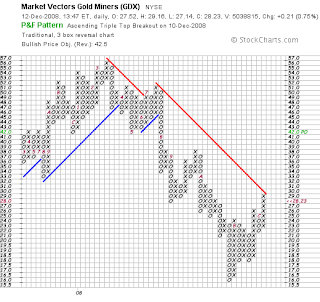
The beauty of the point and figure is its simplicity. Because only significant moves are plotted, much of the noise of a stock gets discarded. In the place of your normal line or candlestick chart, you will get something like the chart pictured below:
 (chart obtained from stockcharts.com. Create your own by clicking here) |
When you make a chart using stockcharts.com certain trendlines will be drawn automatically. In my experience, these tend to give poor or limited guidelines; therefore, we will add some of our own.
Bottoms and Tops:
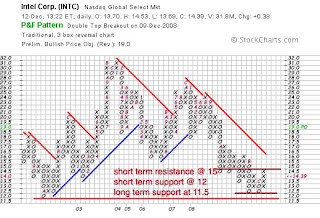
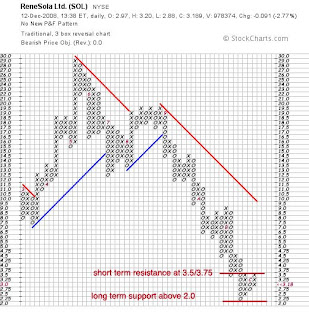
General bottom resistance and top support, whether short term or long, are easy to spot. Using your favorite drawing program (e.g. Paint, Photoshop, or GIMP), take the line tool and draw a line below the bottom-most “O” or the top-most “X”. That is all there is to it:
 |
 |
How to use this new data will not be difficult for the veteran trader, and for the novice, a little common sense is all that is needed. For instance, say your own 100 shares of Apple and it appears to have a long-term resistance at 100 and a short-term support at 80. If it goes up to 100 you will want to consider selling all or a portion of your stake. If the price falls below the short-term support you may want to consider liquidation your position. Furthermore, if the price hovers above support you may want to consider adding to your position. To determine your reaction with greater precision, in addition to point and figure support and resistance lines use other technical, fundamental, and sentiment indicators.
Uptrends and Downtrends:
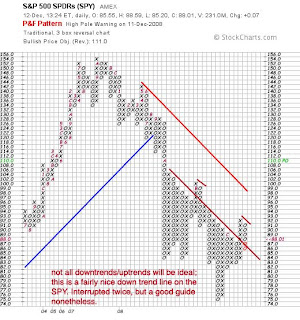
Creating your own uptrend and downtrend lines takes little to no more time than the above. With the point and figure grid as a guideline, find any diagonal pattern of X’s and O’s. Using your favorite drawing program, draw a line along these trends like so:
 |
It really does not get much harder than that.
Expanding your knowledge:
The goal of this article was not to teach you how to configure your own point and figure chart, or even how to decipher one. If you want to learn more about those aspects of point and figure charting, stockcharts has many guides on various technical analysis charts and techniques, and I have started writing one of my own describing patterns and setups to aid you in analysis. The major point of this article was to show you how to create simple areas of support and resistance without having to struggle with excessive noise. Using the above, you should be able to create your own successful support and resistance lines. Despite their simplicity, or quite possibly due to it, these charts make a powerful addition to any trader’s arsenal of analysis techniques.


