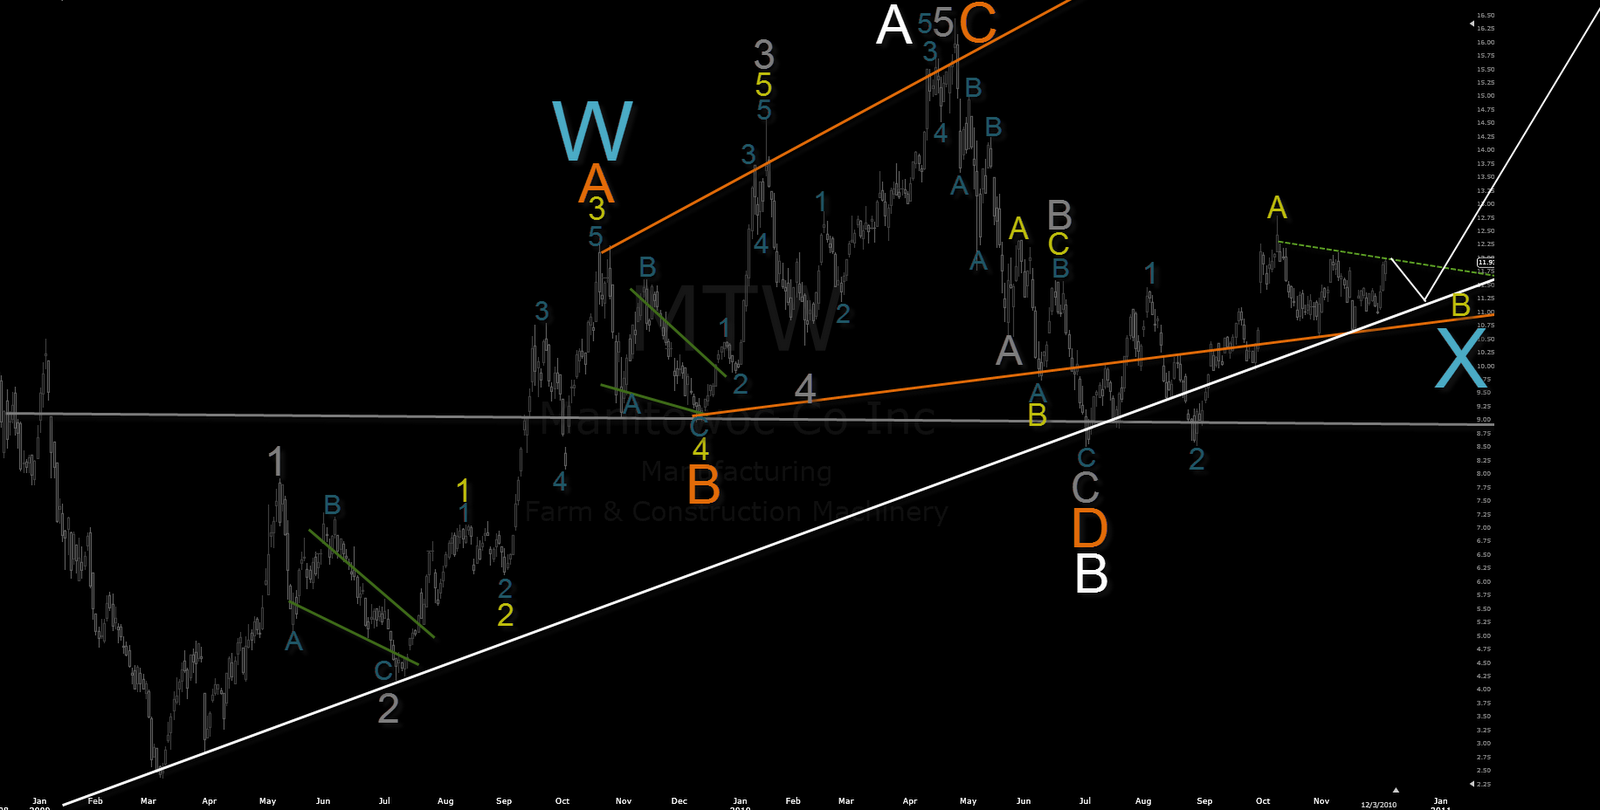
I worked with this chart passed 5 hours together with some other´s to see many different EW scenarios for it and compared it for many other´s. Particulary in this business group.
It might look like a color fireworks show but the reason for that is that if these are still upside corrections highest degrees for them are not impulse waves.
You could easily drop just one W1 and one W2 for that entire chart and nothing else, everyone´s are happy, we have potential W3 settings. The chart has done what currencies are doing every day and week and month. Significant drop behind (or rally), then first reversal reaction comes, overlaps slightly 23.6 % area to locate potential A or W1 wave for it, drops down again to retrace that wave and starts building EW pattern.
Stops again and looking back all the time in which kind of conditions we came down, 3 wave or 5 wave structures.
This is where fighting about actual progressive directions starts again using possible zigzags patterns exist.
It might not be clear allways, particulary if actual EW pattern is not there after some wild ABC wave which can be just fully progressive plunge without any contracting thing.
This is anyway where market starts to re-consider again and looking back what the chart have behind.
Now, then market finds out that god lord, there is one full impulse done, let´s turn it with W2 retracements, overlap them first to blow out all stops, to reach the next one, 38.2% or 50% retracement because both scenarios starts to pinpoint same direction ie. AB condinitions or W1 and W2 condinitions are set. Once there, same starts again, is this ABC or do we locate next higher degree W2 or W4 for it or is it running W3.
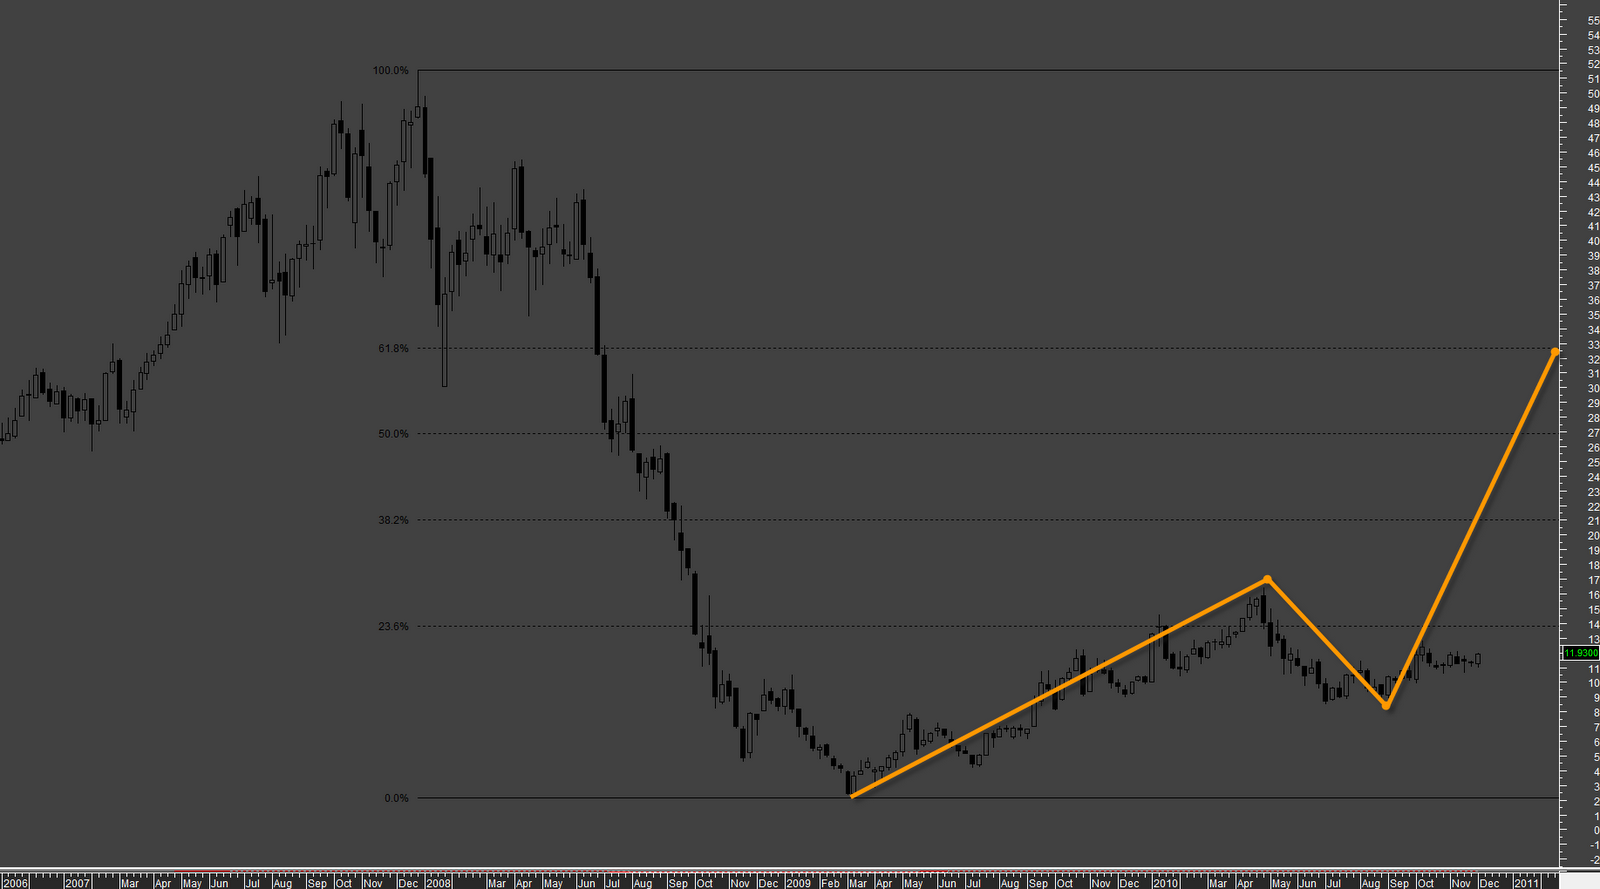
To consider we are still in corrective market ie. bearmarket, the lowest chart is broken for 3 waves only as daily chart degree to build it as ABC where actual drop earlier would be impulse wave. It is weekly chart. There would be louds of smaller 3 wave ABC and ABCD components during the time how it is travelling to be reach on there.
If it is ABC upside correction, it is not real impulse with any high EW degree, they are all 3 wave component and 3 wave component means much more complex world as something simple 12345.
Expanding triangles are one part of those complex families, corrective things.
That 61.8% area is going to be something where market likely would consider this weekly chart is it bearish again with daily chart, because it comes possible. It does have one huge impulse drop behind in the history.
Each of those ABCD waves in the potential expanding triangle construction (Orange letters breakes for 3 waves in it) internally.
It is impulse wave with some degree but potentially not with the very high degrees how these waves and wave patterns are going to be build on there if we are still in very large scale running correction market with some hyper cycle degree which does not interest me anyway.
Complex zigzag trees, they are just not vertically located on there.
EW is doing everything it can in the live market to fool everyone and it is doing that all the time because it does not so many degrees exist that with all the alternates with them one can loose his mind easily with all of them but they are those same patterns they all are just repeating.
Once many of those degrees subdives inside of complex family patterns ie. 3 wave structures, life with it comes complex but also very interesting and challenging.
I am looking 3-C-E-Y impulse for it and my 2011 target for it by end of the 2011 ie. one year ahead from here is set for 61.8% retracement based for weekly chart.
What invalidates my scenario ? One would be if it it is breaking that grey trendline which is log channel size for X is one. White line is trendline, that have nothing to do with EW itself but it is located like that in most double and triple zigzags ie. Harmony One2One patterns.
I would hope that this contracting triangle would become true to place this X, but I do afraid that it is not necessary going to do that anymore when looking 60 min chart for it.
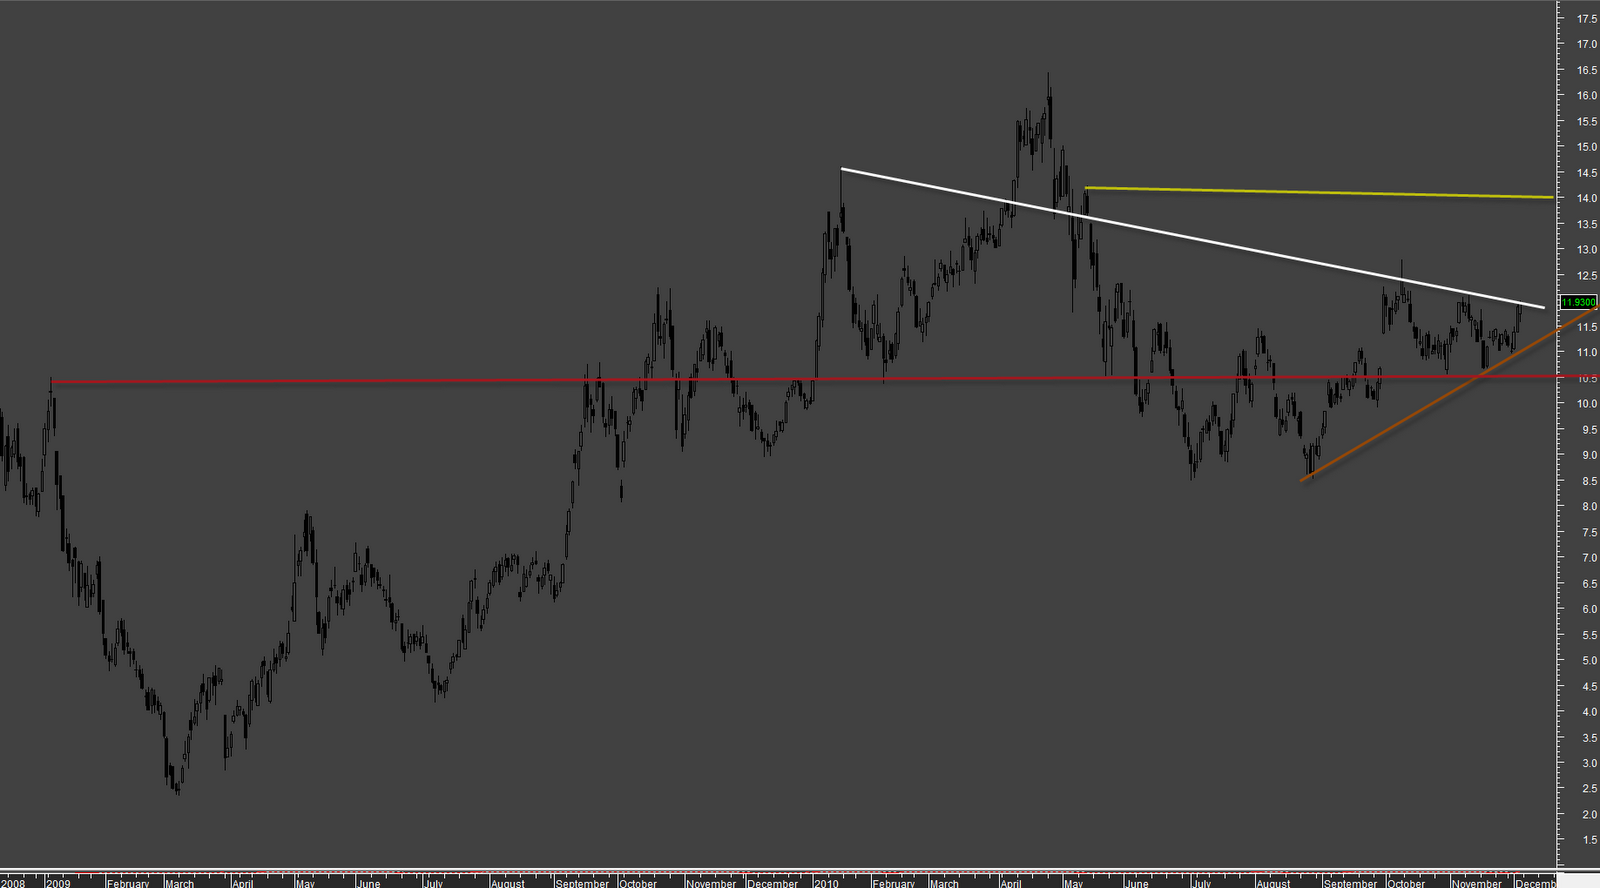
I did attatch some metastock files where technical lines are presented for it without EW.
Simple Pinpoints:
– W1/W2 or A/B condinitions set for W3 or C impulse.
– Chart is Contracting
– Chart is building EW Contracting Patterns
– Trendline Support
– EW Log Channel Support for WX from previous impulse
– Retraced by potential W2 condinitions
– Potential EW expanding Triangle
These views are fully my own opinions only.