

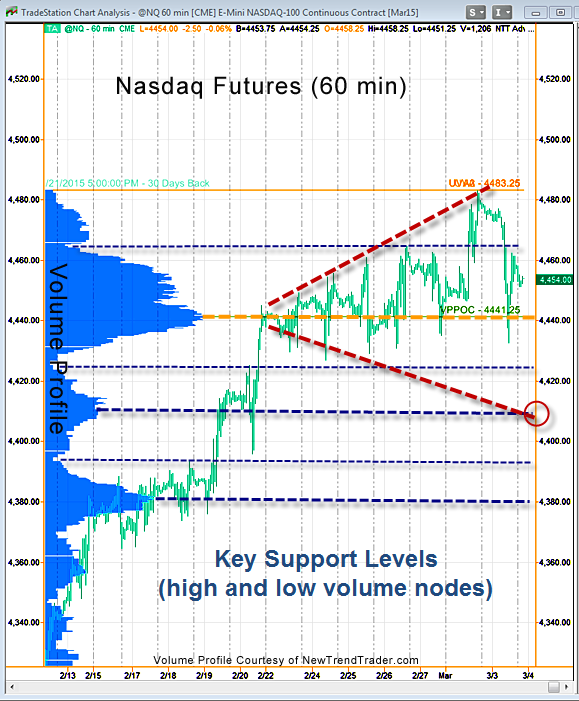
On Wednesday, the Nasdaq 100 survived a test of the Volume Point of Control (VPOC) at 4441.25. Notice the size of the histogram peak (See chart below.). This is a hugely important level, and it has been tested six times in the last two weeks.
The NASDAQ is demonstrating relative strength vs. the S&P and is resisting the pull of gravity.
My upside target zone is 4525-4530. That said, keep both directions in mind. A decisive break of 4441 will stair-step down on those thin blue levels to the red circle around 4410. That’s the classic “megaphone” pattern, which is very common in the NQ.
A Note on Volume Profile
The histogram on the left side of the chart shows the volume distribution in the S&P futures for different periods of time. Key support and resistance levels are indicated by the peaks and troughs.
#####
If you would like to receive a primer on using Volume Profile, please click here.

