

On Wednesday the Nasdaq 100 dipped down into its megaphone pattern, but without a lot of enthusiasm. In other words, the selling did not get intense or vicious.
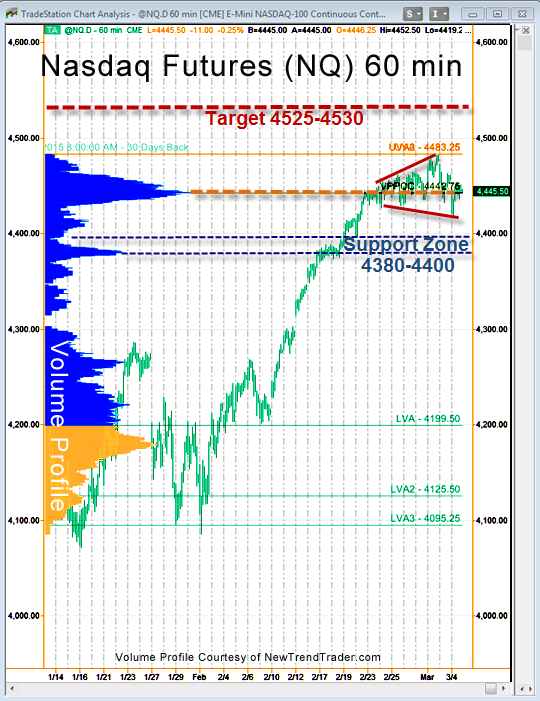
The futures closed the day session (shown on this chart) very near to the Volume Point of Control (VPOC), which is now 4442.75. Again, I’d like to point out the size of the volume histogram peak at that level. This area is acting as a strong price magnet and stabilizing factor. That’s bullish for the tech index, which is outperforming the S&P.
My upside target zone is 4525-4530. The downside support zone is 4380-4400. Keep both in mind because conditions are choppy.
A Note on Volume Profile
The histogram on the left side of the chart shows the volume distribution in the S&P futures for different periods of time. Key support and resistance levels are indicated by the peaks and troughs.
#####
If you would like to receive a primer on using Volume Profile, please click here.

