

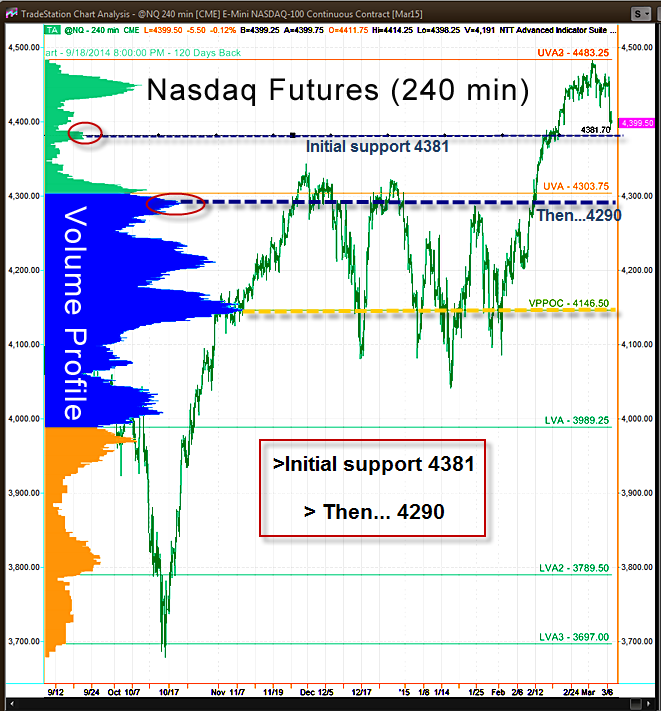
The Nasdaq 100 stubbornly resisted correcting until last Friday, when sellers finally broke key support at the 4443 level and created some decisive down side momentum. It’s likely that momentum will continue to the 4381 level where we have a small high volume node (see red circle on chart).
Unfortunately, that node is almost irrelevant in contrast with the larger nodes below it; the nearest being 4290 (also circled in red). When markets correct they tend to stair-step down to important levels, and that 4290 level should act like a magnet for the NQ.
So, here’s the forecast: 4381 on Monday, with the NQ likely to move at least 100 points lower this week before stabilizing.
A Note on Volume Profile
The histogram on the left side of the chart shows the volume distribution in the S&P futures for different periods of time. Key support and resistance levels are indicated by the peaks and troughs.
#####
If you would like to receive a primer on using Volume Profile, please click here.

