

Last week was a choppy trading week for the major market indices with one green day that led us to believe that the trend might continue higher and that was followed by two red days that took the indices back to prior tested support, and then a neutral day ahead of the Easter weekend. The market traded on thin volume, as expected ahead of a long weekend.
Analysts suggest the reason for the correction last week was quarter-end, profit-taking, but what about the so-called window dressing? Stocks failed to rally at the end of the quarter.
Traders Beware
Even though the market was closed on Friday, the jobs numbers were released, and the numbers showed only 126K jobs added, while projections were for about 240K – well below expectations. The Futures market reacted violently to this report –the Nasdaq and the S&P 500 E-minis took a 1% dive to the red side.
QQQ and SPY – Short-Term Downside?
The S&P 500 (SPX) and Dow Jones ($DJI) both finished the week in positive territory with trading gains of 0.3%. Nasdaq (QQQ) ended the week mildly negative -0.1%, while IWM finished the week in the green with 1.2%.
Technical Levels and Analysis of Major Market Indices
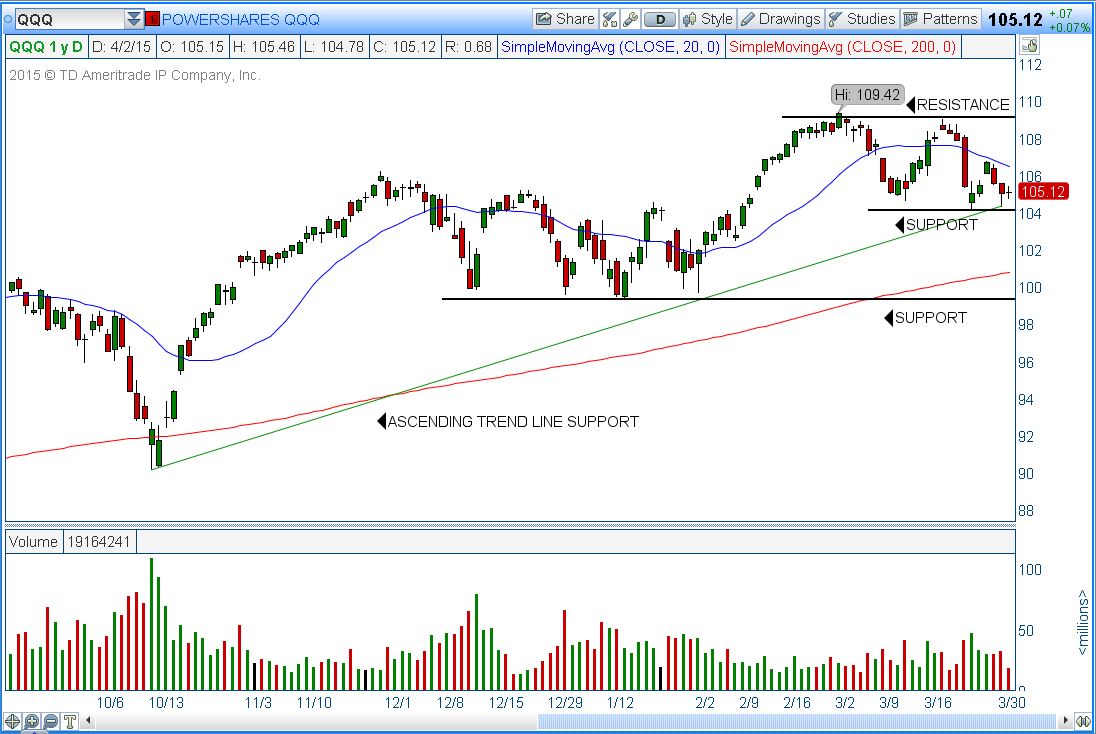
QQQ
- Bias: Neutral. on a break of $104.00 the move will become bearish with a wide void to fill into the next support area at $100.00.
- Support: $104.00, $100.00.
- Resistance: $109.00, $109.42.
Daily Chart of QQQ below represents the ETF’s trading activity until Friday’s close
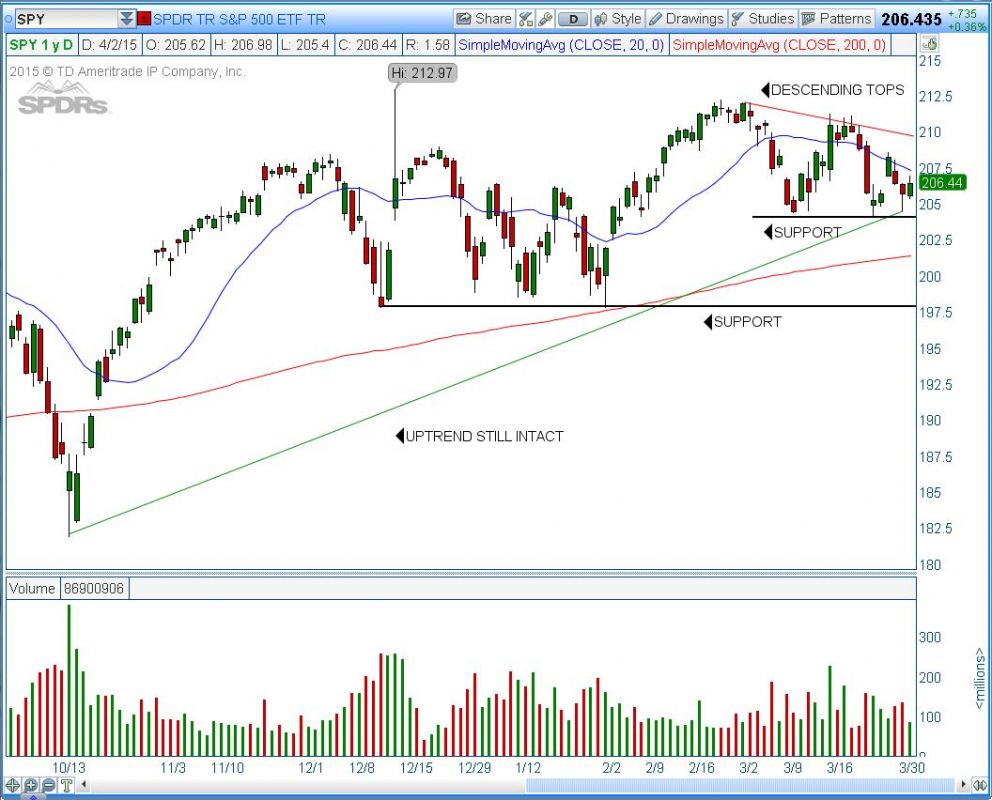
SPY
- Bias: Neutral. On a breach of $204.00 support level we can start thinking bearish due to the wide void all the way to the next area of support $198.00
- Support: $ 204.00, $198.00
- Resistance: $208.65, $211.00, $212.30
Daily Chart of SPY below represents the ETF’s trading activity until Friday’s close
Stock To Watch — WHR (The Whirlpool Corporation is an American multinational manufacturer and marketer of home appliances)
Technical Pattern and Trade
Strong uptrend from the break-out that occurred last November with a huge rocket bar up to early February, then the pullback started setting a new support above $190.00. The area I am watching is $200.00 for an aggressive entry, with a flex stop for a target into prior high $217.00. For a more conservative approach you will have to look for price confirmation over $204.00 with a stop under $198.50. For this trade I would move stop to a BE area as soon as the price reaches $210.00 and I would also take half the trade off. Next potential targets: $214.00 $217.00, $220.00 and room to run all the way to $250.00 area for a longer term trade.
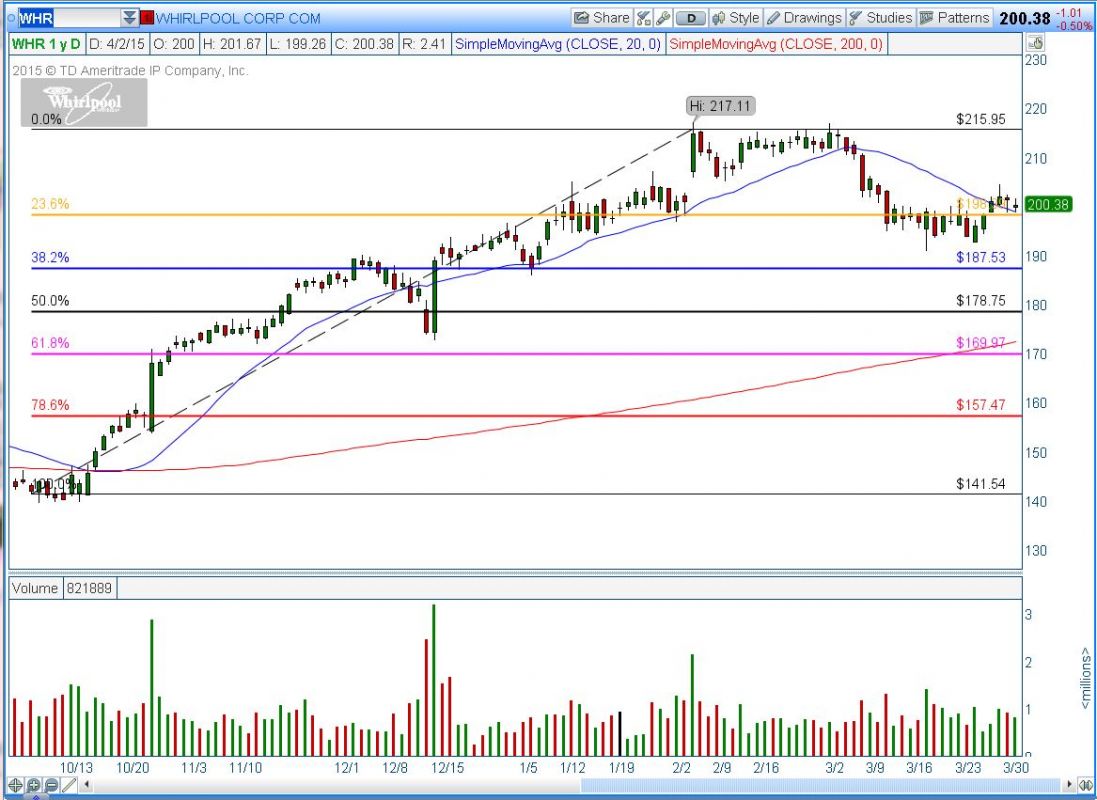
Note: The Fibonacci price retracements from Oct 2013 swing low to the February Swing high.
#####
For more information on Anka Metcalf and TradeOutLoud, please click here.

