

During the long equities rally from the 2011 low to the 2015 highs, the S&P Midcap 400 Index behaved well with respect to chart geometry. In that light, the index’s recent departure from its guiding channel serves as both a warning to market bulls and a clue about where the next bearish trade might take place.
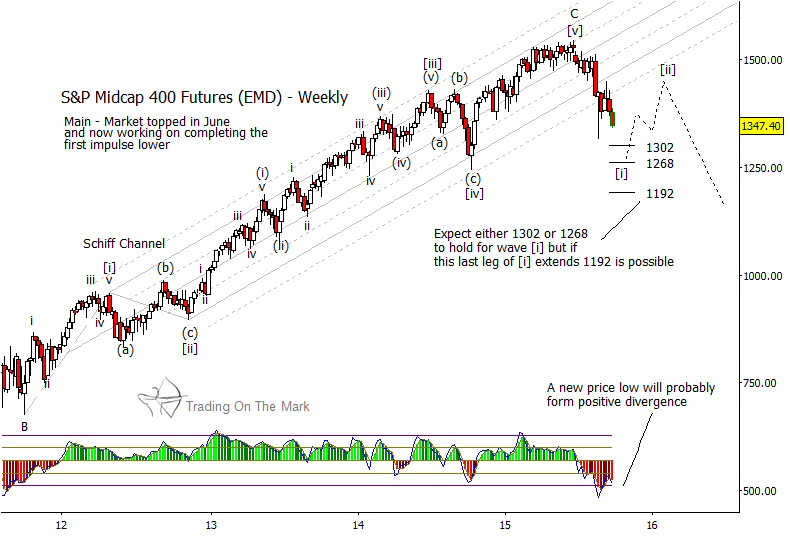
On the weekly chart for the futures contract, below, notice that many of the intermittent price highs and lows since 2011 recognized the major boundaries and also the “harmonic” lines of the Schiff channel that we have anchored at Elliott wave points [i] and [ii]. In particular, the lower boundary (solid line) acted as support during the October 2014 low – a typical signature of a fourth wave.
In recent weeks, price has departed more decisively from the channel, suggesting that a new market structure is forming. To confirm that idea, we would want to count a five-wave downward push from the summer high. The criteria for that are almost in place, needing only a modestly lower low on a weekly time frame to create downward wave [i].
Of the three support targets we have drawn for wave [i], we believe the index is most likely to test the middle one near 1,268 before rallying in a seasonal wave [ii]. However, it is important to note that even the higher target of 1,302 would satisfy the requirements for structure. In the unlikely event that the last internal segment of wave [i] extends, it could take price as low as approximately 1,192.
The best opportunity for a short trade on a weekly time frame or higher probably will be when the index tests the area of broken support in upward wave [ii]. That test probably will occur near the lower boundary of the old channel or near one of its outside harmonic lines. We believe that opportunity may come late in 2015 or early 2016, and we will be able to calculate a more precise target after downward wave [i] is complete.
Get timely market updates by following Trading On The Mark on Twitter.

