I deleted that cole chart, I don´t think it is good because it does have falling oscillators.
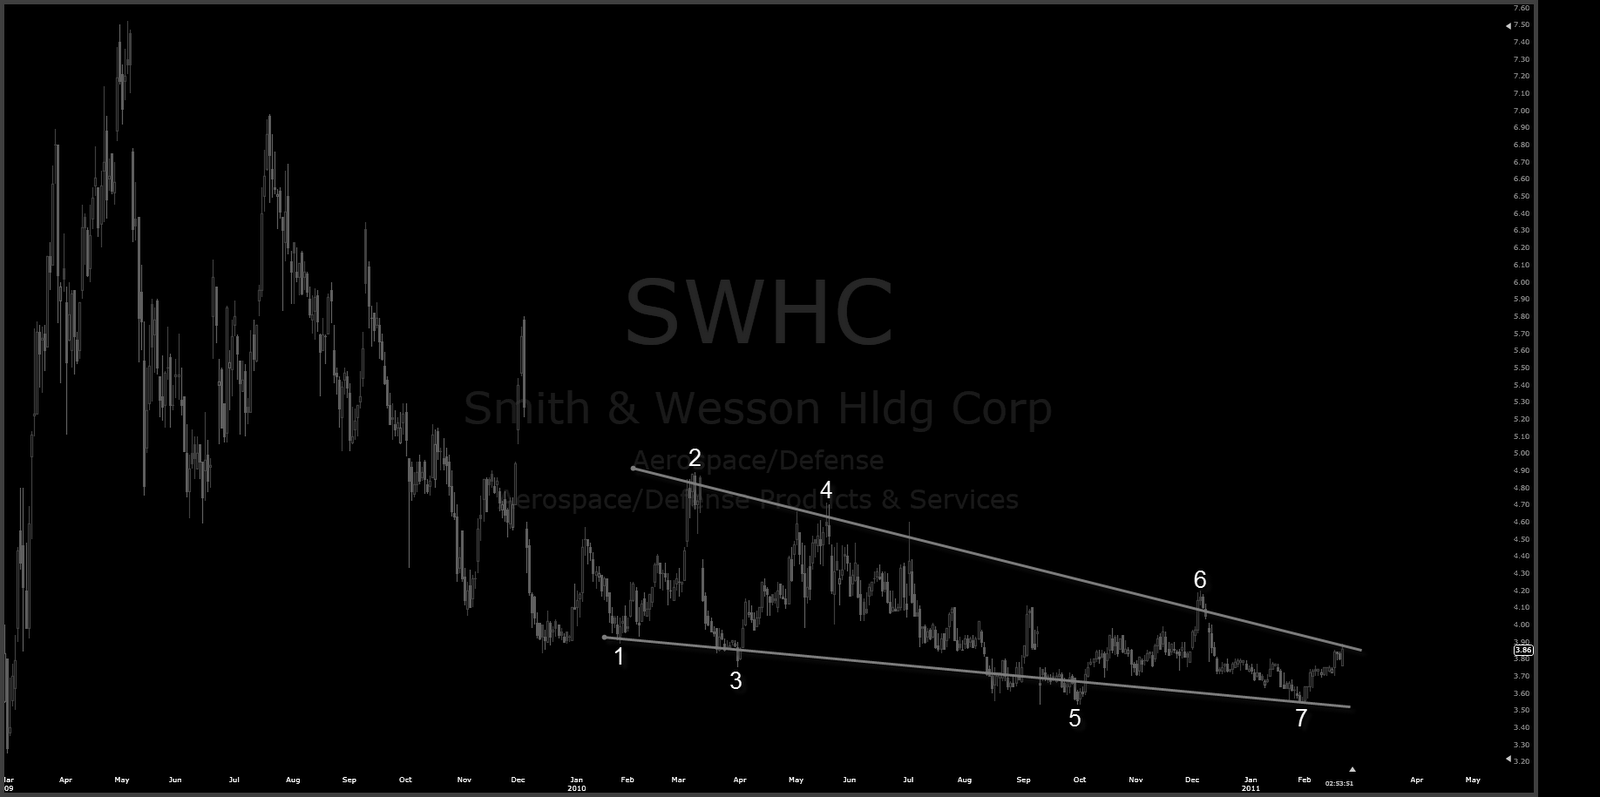
SWHC starts to look similiar as STP did 2 months ago.
My TTHI reached today +100% advance with it´s +23% day candle. However most interesting chart is DAKT, it cracked down today -25% after wild run for earnings news. It was also my first long based triple zigzag explosive pattern on last autumn.
Perhaps it was time to get some action for that lazy SPX plus it´s Index stocks. They had been ugly + dead anyway over that last 3 months allready. So far, it was bearish for aviation and bullish for oil stocks to describe it with one word.
I didn´t do anything actually – because my investment strategy is not based for chrisis, it is based for unique EW charts only. However, SPX likely did have 60 min ending diagonal. It is possible something more important ended with it, with that degree of cource.