

By: Zev Spiro
The major market indices are sending out mixed signals that need to be resolved. The S&P 500, DJIA and Nasdaq-100 Indexes, still in bullish trends, are above their 20-day moving averages and all but the Nasdaq 100 are still above their intermediate up trend lines that began last September. The Russell 2000 Index, however, is telling a very different story.
Recently, the iShares Russell 2000 Index Fund (IWM) broke it’s intermediate up trend line and the 20 day simple moving average. Moreover, an extremely rare and bearish price pattern may be forming called a broadening top formation, or “megaphone”.
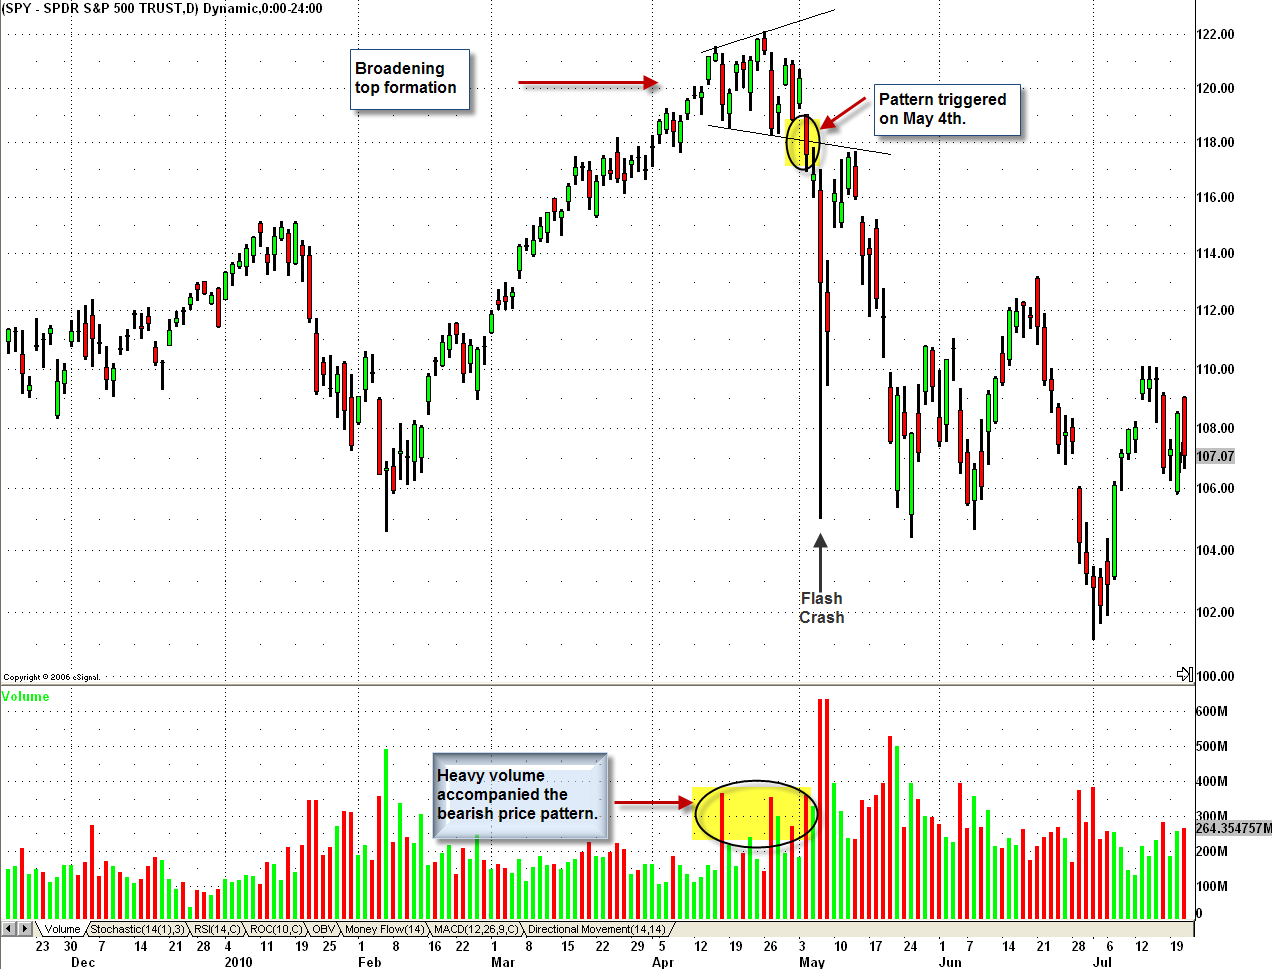
In this pattern, the price continuously makes higher highs and lower lows between two diverging trend lines. Volume during a broadening formation usually runs high and the pattern resembles a market that is out of control and lacks leadership from smart money. When this type of pattern triggers (can be seen in SPY right before the “flash crash”), the resulting down move is fast and furious. With the above in mind, it is important to monitor the divergence between the Russell 2000 Index and the other major indexes, to determine if the major markets can sustain their current uptrends or not.
Chart 1: Illustrates the recent technical damage in the iShares Russell 2000 Index Fund (IWM) and the potential broadening top formation, or megaphone, pattern that could be developing.
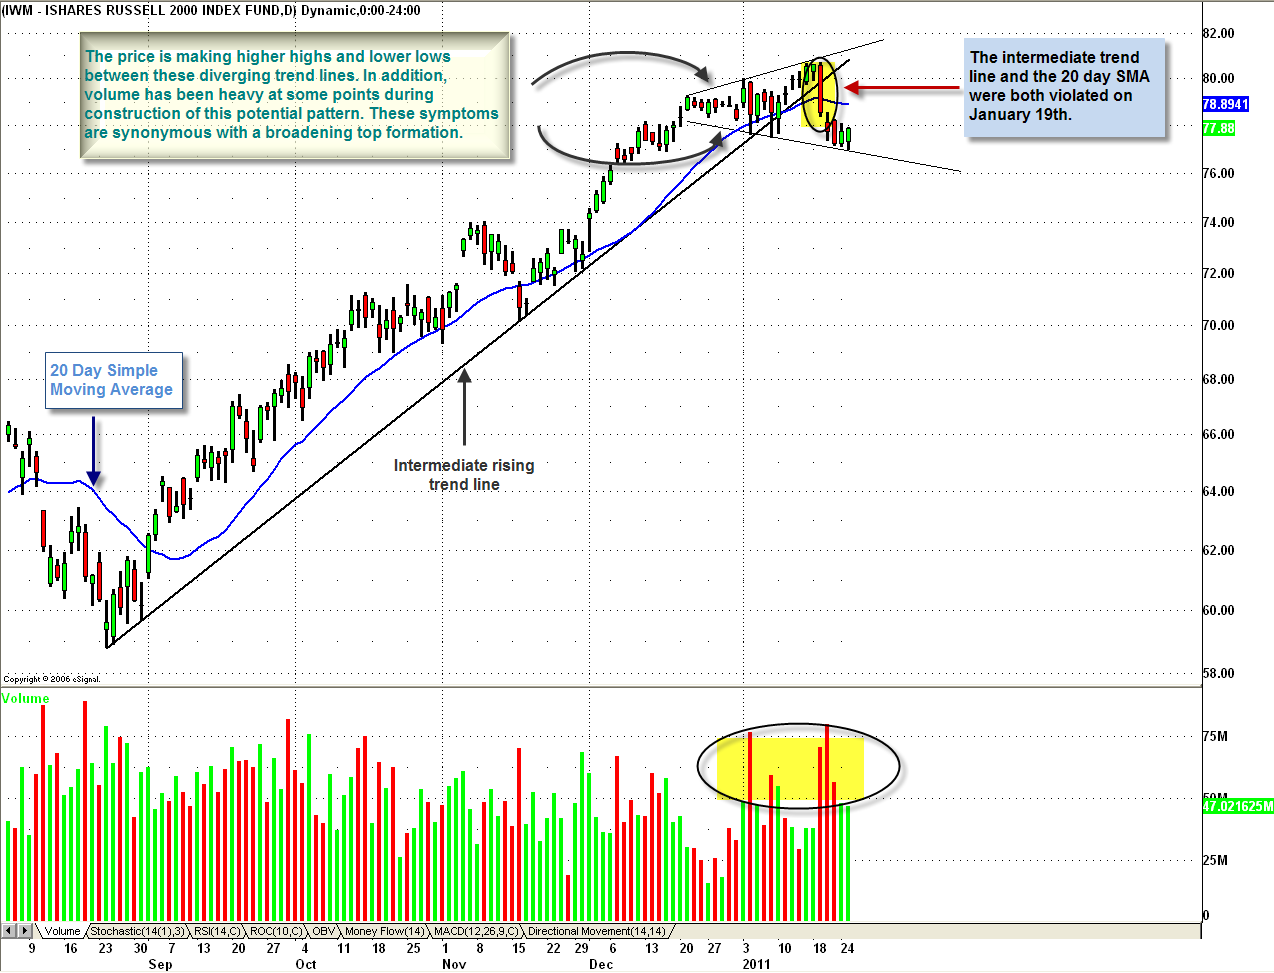
Chart 2: Below is an example of a broadening top formation, that triggered in SPY two days before the “flash crash” on May 6, 2010. When this rare type of pattern triggers, there is usually a very quick down move that follows.
As I have mentioned recently, it is becoming increasingly difficult to find quality risk/reward long ideas to initiate in. Currently, maintain long positions that are trending higher using tight trail stops and consider shorting the market and/or individual names to hedge. Outlined below is a trade idea for a short in Dril-Quip, Inc. (DRQ). This is a thin issue so be cognizant of prices.
Chart 3: Displays the break of an uptrend in comparative relative strength of Dril-Quip, Inc. (DRQ) versus the Dow Jones US Oil and Gas Index ($DJUSEN).

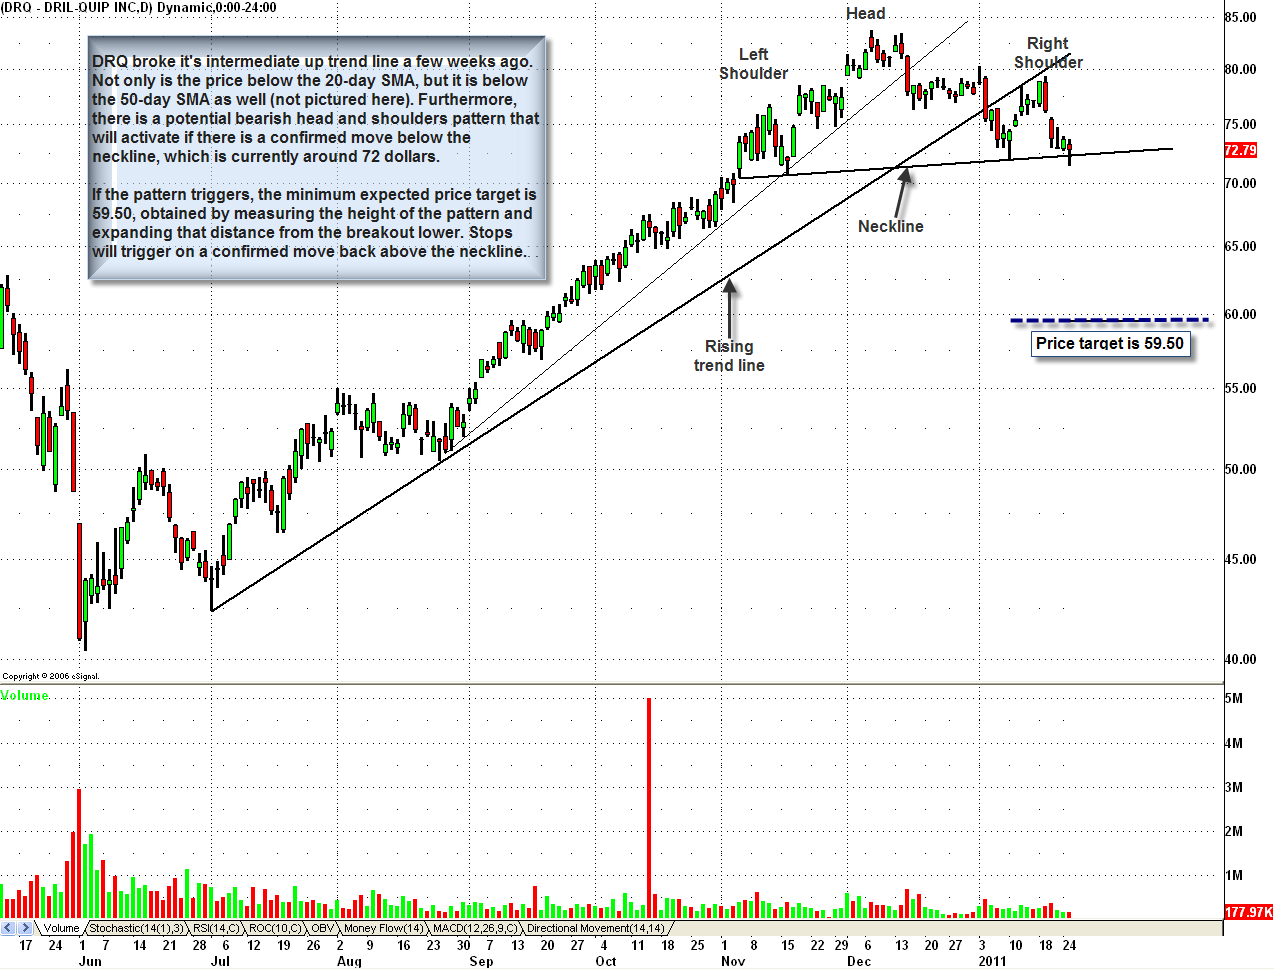
Chart 4: Illustrates a potential bearish head and shoulders pattern on DRQ that will trigger on a confirmed move below the neckline. Target: $59.50, Stops: Confirmed move back above the neckline.
If you are interested in receiving Zev Spiro’s market letter, please email zevspiro@oripsllc.com subject “T3”
*DISCLOSURE: Long SPY and DRQ
This material is being provided to you for educational purposes only. No information presented constitutes a recommendation by T3 LIVE or its affiliates to buy, sell or hold any security, financial product or instrument discussed therein or to engage in any specific investment strategy. The content neither is, nor should be construed as, an offer, or a solicitation of an offer, to buy, sell, or hold any securities. You are fully responsible for any investment decisions you make. Such decisions should be based solely on your evaluation of your financial circumstances, investment objectives, risk tolerance and liquidity needs.

