
This page will be updated on a bi-monthly basis. The latest data typically is always at least three days old, due to the forward pricing of its funds. For questions or comments please click here!
TO REDIRECT TO THE LATEST UPDATE, CLICK HERE!
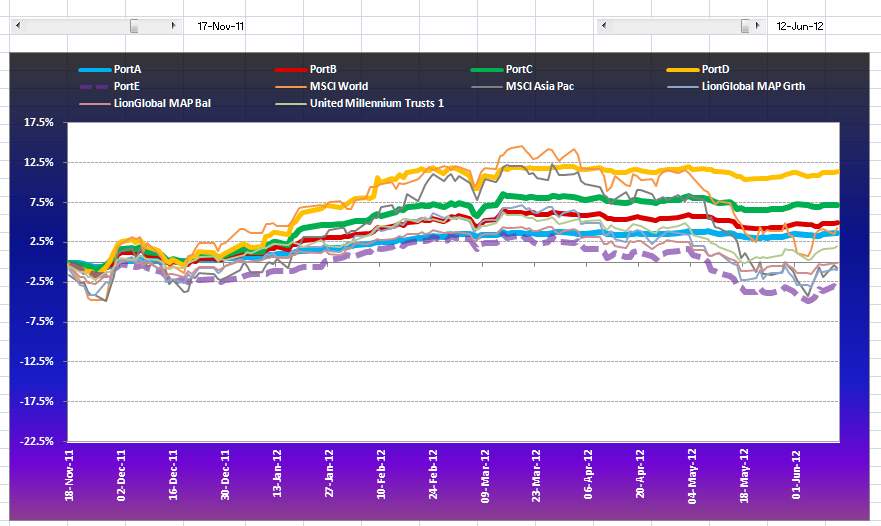
The latest update (15-6-2012) once again shows up the hallmarks of our investment strategy. This is a view from November 2011 till mid June 2012. Our strategy was to stay with the markets till March and then take profit, reducing equity holdings by 50%. Sensing more sinister investment conditions ahead in May (see dip in the markets), we sold of all remaining equities as soon as markets had bounced back a little. Thereafter, we recommended cash and bonds only. We remain cautiously positioned but are on the lookout for a change in investment conditions.
Over just these 8 months, the models A-D outperformed the market, taking profit at the most appropriate time and thereby opening up a margin of almost 10% as of 15-6-12.
Since inception in October 2009, Model D (highest risk) outpaces the MSCI World by more than 20%. On a different note: please observe Model (PORT) E, the purple broken line. This model is meant to follow the markets with the added benefit of being less volatile. It only rebalances once or twice a year. You can see that over this reporting period, it does do what it is designed for, ‘good enough’ for long term investors you might argue.
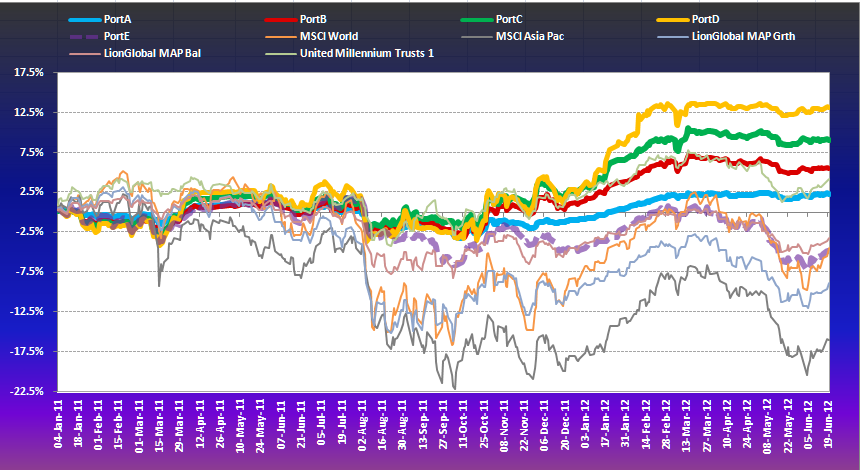
Here the 18-month chart that simply confirms our statement above:
 |
| model portfolios compared with market benchmarks Nov’11 – Jun ’12 |

