
The latest update (29-2-2012) once again shows up the hallmarks of our investment strategy.
For the participant, it needs little explanation! But for outsiders, here is some background.
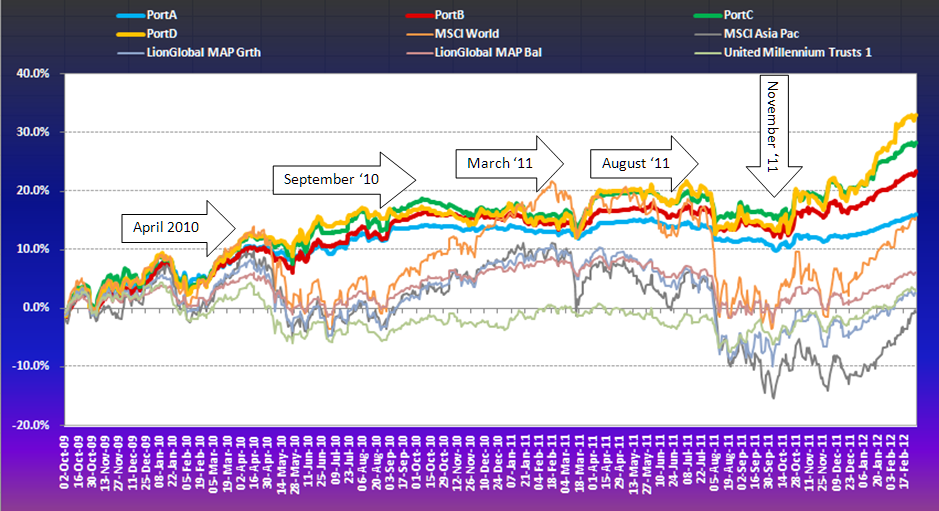
April 2010
Our first ‘coup’ was to recognise the dangers in April 2010, saving portfolios some 15% drop. Thereafter we could take it easy: our re-entries were highly successful (stepped entries).
September 2010
The exit in September 2010 may look tepid. The MSCI World kept rising till February 2011, so did the Asian indices, but to a much lesser degree. And yet, at the same time the Singapore Dollar also rose to 1.20 against the USD. Safety therefore may not have produces a firework of returns but having secured a nice margin against benchmark funds and the MSCI Asia ex Japan, we slept rather peacefully.
November 2010
We attempted an equity engagement after a correction in November, but our still heavy focus (65%) on Asian equity did not produce significant gains.
We exited in
January 2011
Stocks fell hard into February thereafter. We reengaged in the last week of February.
March 2011
March brought the Japan disaster – and portfolios benefited from the drop – and subsequent rise of stock markets: we had identified trends that not only stayed the course during the crisis but accelerated from there, outperforming markets decisively.
May to August 2011
A hectic time followed as the writing was on the proverbial wall for a decisive correction. We tried twice to re-enter after an April exit, but none of these really made any headway. The correction started in earnest August 4th, we were out (all equity to cash) on August 5th, arguably another outstanding exit time, considering the subsequent drop of more than 25% in global markets.
November 2011
We took our ‘own sweet time’ before reengaging. After the final thud on October 3rd, I advocated a stepped approach to reenter markets, in almost identical steps of 35%, bringing exposure back to their highest levels by December. The result is plain to see: we used the volatility to buy into the markets and kept increasing the equity alloation while the positive margins to global market indicators expanded further.
February 2012
By the end of February, mirroring the models, our actual client portfolios had recaptured and in several cases exceeded previous highs leaving every benchmark trailing, by as much as 35%.
NOW!
This resounding result is not just astounding, it also provides the best reason NOT to rush into a risky market unless we are 100% sure it will bring positive results, – like the most recent period between November and now. How to assess that correctly is – my prerogative.
Right now, we are rather on edge and prepared to exit markets if market sentiments show signs of significant deterioration. At the moment, such a change is more likely the result of unforeseen circumstances like a tsunami, or a 9-11 event. Europe and debt problems are on the back burner for the time being.
November 2011 to NOW!
Looking over longer periods of time (like above chart since inception in October 2009), with some luck portfolios look as though we were just lucky enough to avoid downside. But little can be seen immediately as to whether we can actually perform in a positive market. So let’s review the latest rally period since last November.
Did we really do something extraordinary? Our portfolios are the FAT Lines, gold, green, red and light blue.
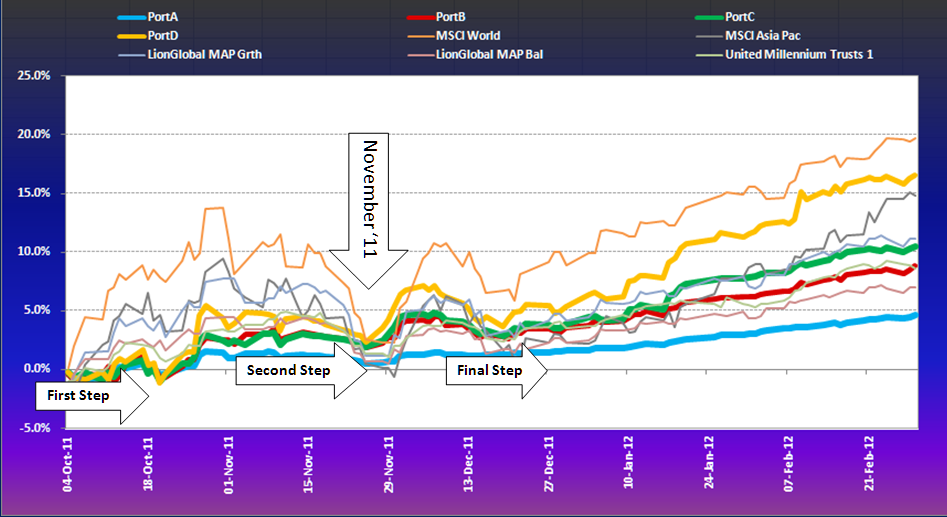
Apart from taking a bold decision to accept our research as is, indicating another round of fairly steep ASSET INFLATION when everyone else around us foresaw another 2008 in the making, we did only the most basic and logical steps, still seeking confirmation by additional technical analysis. Indeed, rather pragmatically we dollar-cost-averaged into the market some 3 times and it so happened that the final step coincided with the time when the markets really took off in an environment of favourably reduced volatility. During that phase, the hi risk TREND model in gold outperformed the MSCI World as is the case during most bullish markets.
As you can see, what we did is not rocket science, no need for quantum physics, algorithmic genius, or metaphysical models. And yet, we outperformed even exalted hedge funds of MAN, PAULSEN and SALUS ALPHA by a few hefty percentage points.
We Think There Are More Such Chances Coming This Year. So why not sign up to one of our portfolio services?
Disclaimer:
Please note, the model portfolio graphs here do not reflect charges on the portfolios, such as initial charges on purchase and ongoing management fees (WRAP fee). It also ignores any platform and other auxiliary costs that may be incurred. As a rough guideline to the impact of costs, please deduct about 2% per year from the annual return.

