Thursday 21 January 2010
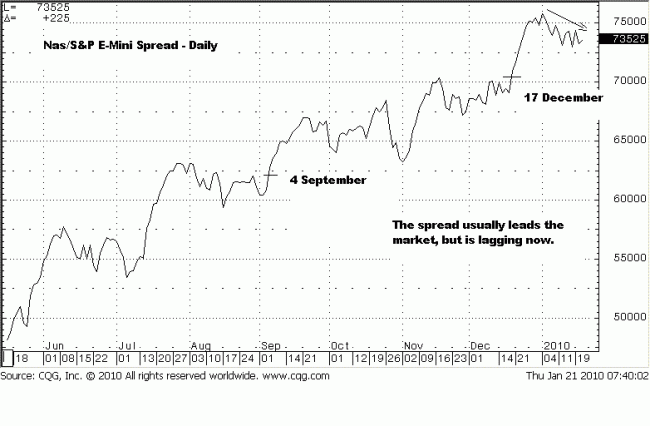
Last week, we brought to your attention the Nas/S&P E-Mini spread as a leading
indicator for market direction, NAS -E-Mini Spread – A Clue For Market Direction,
click on http://bit.ly/8JyYYC. We take another look at it today and compare it
to the daily S & P chart to show what may be a divergence in the spread’s
leadership.
4 September and 17 December are indicated on the spread chart to be
compared to corresponding dates on the daily S & P chart. The S&P price was
cut off around the 4th, but price was under the highs from a week or two earlier,
while the spread was already breaking upside out of the same trading range,
leading the way up.
The spread was also leading the way out of the November/December trading
range several days before the market did. A quick comparison between the two
charts and dates shows this clearly. Right now, the spread is struggling, having
made high on 4 January, a full week before the market high on 11 January. It
continues to make lower highs and lower lows. The market, by contrast, has
remained sideways in a rather dramatic fashion, down 1300 tics, up 1300 tics,
down 2200 intraday…evidence of a trading range.
The leadership quality of the spread has been lagging. Based on previous
early signs, it is difficult to see the market rallying until the spread turns back
up. It is too soon to know if the spread is signaling a turn, or maybe it is
obvious already and the market may break recent supports and turn down.
We will get confirmation of a market turn if and when price breaks under the
1150 – 1125 price levels defining the range.
The weekly trend remains up, but progress is laboring. The daily trend has
fast become range-bound in a January trading range with an upward bias, and
the intra day trends are in a trading range making sharp up and down moves.
The sharp moves intra day are signs of a battle between the forces of supply
and demand.
Volume on Wednesday’s wide range downside break was greater than previous
breaks, but the lower end of the range held the selling efforts. Buyers
successfully defended their territory as shown by the close, just under mid-range
on the bar. The only way we will know which way price is headed, with any
degree of staying power, is when the highs are exceeded or the lows. Until then,
the current trading range struggle continues.
The spread is suggesting a break, but it needs another lower close under 730
to confirm its leadership has turned down, and the market will soon follow.
What we need to do as traders is to wait and follow the tape.
Waiting.


