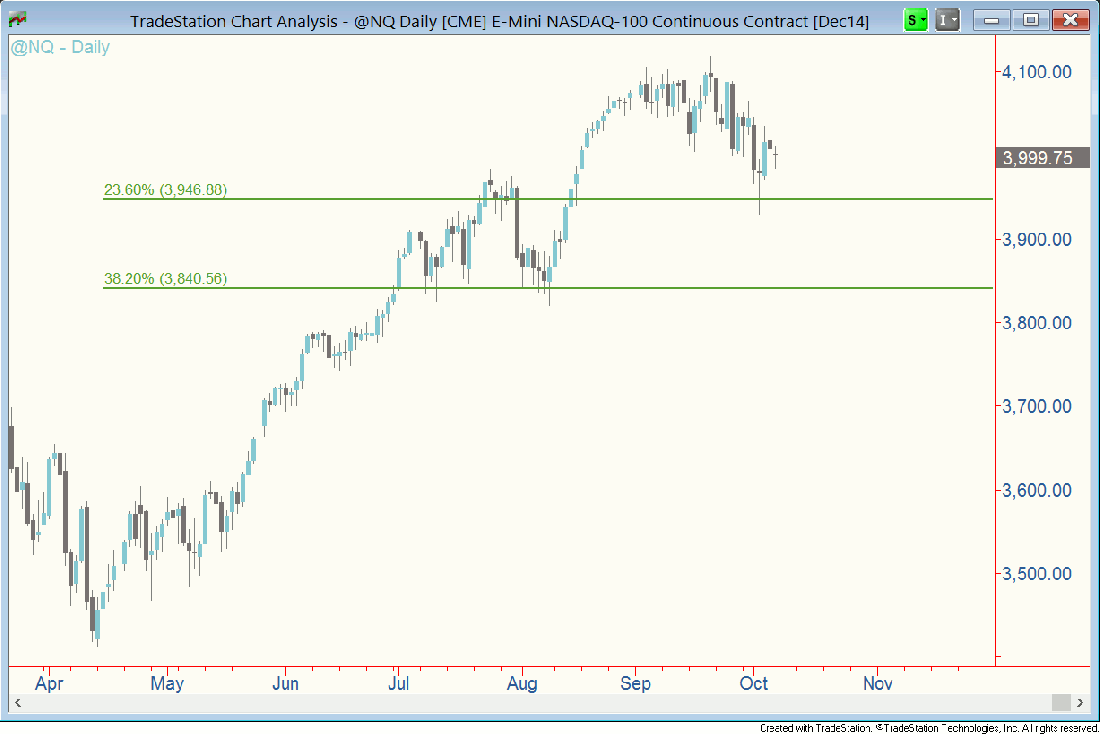
The decline in equities since mid-September has flashed a yellow light for those positioned for gains. Particularly concerning is the price structure of the major small-cap indices, something I’ll address in a separate comment. That said, there isn’t any evidence of a major top in the large-cap indices. And we’re coming to the seasonally strong November-January period for stocks. I’m treating this as a dip-buying market until the market tells me otherwise. And technology continues to outperform the broader market, making NASDAQ 100 futures (or PowerShares QQQ Trust for ETF traders) an attractive space to monitor.
Key Levels To Watch
I say “monitor” because I’d like to see a clear sign that the sellers have been exhausted before advising anyone to buy the recent dip. The daily chart of NASDAQ 100 futures shows nothing but the price action and two technical support lines. The higher one at 3,946.88 is a 23.6% retracement of the rally from April to September, the lower one at 3,840.56 a 38.2% retracement. These are natural percentage retracements to occur during a pullback before a trend resumes.
Watch The Candles
Especially considering how they line up with past turning points in price, there’s a decent probability the recent dip will conclude around one of those two support lines. And keep in mind the 23.6% retracement line has already been tested. What we want to see now is some bullish evidence in the candlesticks and improvement in momentum on the 60-minute chart to suggest the sellers have been satisfied. The lower shadow on October 2 is an encouraging start.
Good trading, everyone.


