Natural gas and gold are a story of contrasts. Gold has been a record-smasher, climbing above $1,115 an ounce, while natural gas is hovering near seven-year lows at a time of the year that is usually seasonally strong for this market. While the outlook remains bullish for gold, the picture is somewhat mixed for natural gas. However, I don’t think natural gas will sink much lower as the worst is likely priced in, and current levels could represent a good buying opportunity if a global economic recovery takes hold.
Natural Gas Fundamental Outlook
December NYMEX natural gas futures closed 4 percent lower on Tuesday, November 10, at $4.482 per million British thermal units (MMBtu) after the International Energy Agency released a report predicting an “acute glut of gas supply” in the next few years.
For the week ended October 30, data showed natural gas in U.S. storage at an all-time high of 3.788 trillion cubic feet, 11.1 percent higher than last year and 12.3 percent above the five-year average.
We’ve got lots of supply, which of course has been bringing the price down. Why do we have so much supply? It’s pretty simple–we aren’t using it. So far this month, we’ve seen seasonally high temperatures across North America, and that is expected to last a few more weeks. If we aren’t burning fuel, we are storing it. This year, there is an El Nino pattern in the Pacific, which means warmer weather is coming off the ocean, across America and into Canada. The U.S. Climate Prediction Center expects El Nino to be present throughout the winter and likely to create above-normal temperatures for much of the northern U.S. and Canada. Of course we don’t know how the weather forecast will play out, but this is the best resource I could find in terms of what we might expect this year. That could mean less use of natural gas for heating.
From August to the end of November, hurricanes can shut down production. This season there have been no hurricanes affecting the natural gas belt. The closest thing we’ve had is “Ida,” which didn’t materialize into anything but a tropical storm. It didn’t close production and didn’t materially affect operations.
About two-thirds of natural gas consumption comes from heating; the remainder comes from industry use. While heating use could be weak, there is a little glimmer of hope that natural gas consumption for industrial use will increase. It is starting to rise in North America, and growth of 0.3 percent is anticipated for October.
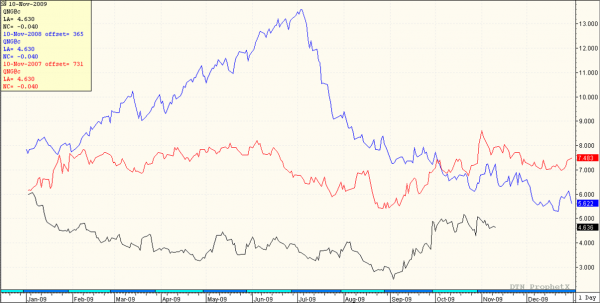
In the chart below, we can see how much cheaper natural gas is today compared with the prior few years. The red line represents natural gas prices in 2007, the blue line 2008 and the black line 2009. Today, prices are about $2 less than 2008 and $3 less than 2007. Although the picture looks gloomy for this market, it’s been priced into the contracts. So there may be room for growth. It seems pretty cheap right now, and a lot of analysts think it could be oversold.
Natural Gas Inventory
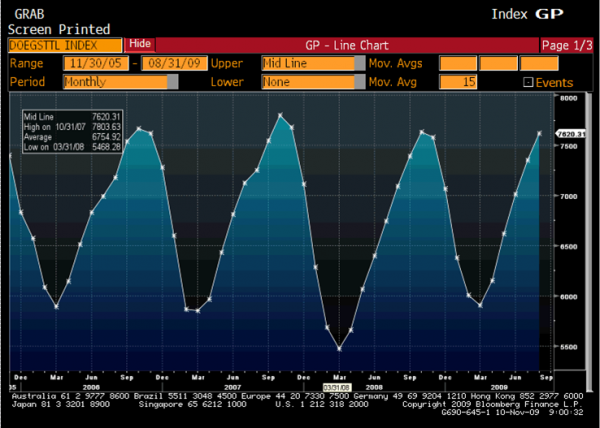
Total natural gas inventory, a combination of working natural gas and base natural gas, gives us a better indication of the supply situation. Seasonally, we have much higher inventory than what we’ve seen previously, and that’s scaring off investors. Although we have a huge supply glut, we know this market is cheap in contrast to crude oil, which has more than doubled this year. So, there could be an increased substitution effect between these fuels. You can’t fill your car or truck with natural gas, but some older buildings can switch to natural gas for heating, new buildings are being built to utilize natural gas, and other industrial processes can utilize more natural gas as well. We’ve seen natural gas trade to very low levels, but I don’t think it will collapse to $1. Companies may not go forward with new fields at these low prices, but shutting down existing projects is another matter.
Technicals
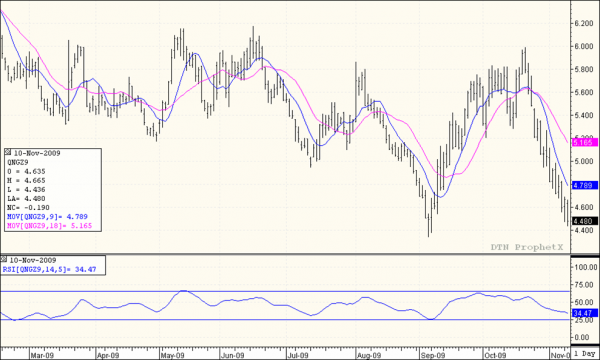
Looking at technicals, the chart below shows the 18-day (slow) moving average in red, and the 9-day (fast) moving average in blue. When the blue line crosses the red from below, that’s a bullish signal and you should consider buying, and when it crosses from above, that’s a bearish signal and you should consider selling. This market isn’t showing any new signals at this time, but the trend is still down. I don’t think the market’s recent dip to $4.35 is a significant support point, and probably won’t get much respect.
The relative strength index (RSI), a momentum-based oscillator, is at about 34. It’s signaling natural gas is becoming oversold. If the RSI drops to 25, I think that’s a good indication the market may be bottoming, and a good time to consider buying natural gas futures.
You can trade either full or mini-sized NYMEX natural gas futures contracts.
Full Natural Gas Contract
10,000 mmBTU
10-cent move is $1,000
Margin is $6,750 (current, subject to change)
Contract value $45,000 (current; subject to change)
E-Mini Natural Gas
2,500 mmBTU
10 cent move is $250
Margin is $1,688 (current, subject to change)
Contract value $11,250 (current; subject to change).
Natural gas is very volatile commodity; 30-cent days are not out of the ordinary. I would suggest moving in with mini-sized contracts at advantageous times if you are bullish. I do think the worst has been priced in, although this market can correct further. However, I think as winter sets in and the economic recovery takes hold, prices will move up.
Gold Outlook
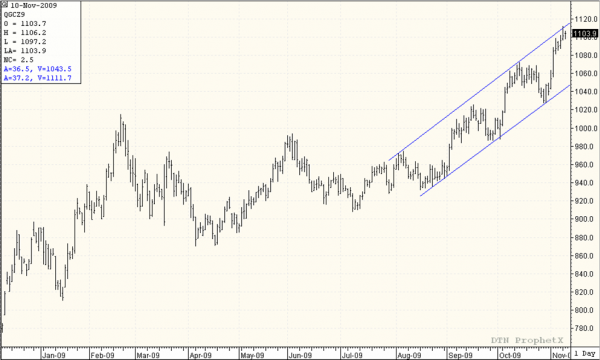
Gold has been surging, moving up in a well-defined channel. I’m bullish longer-term and think this market will see $1,200 in the next two-three months. However, I expect some type of correction in the short-term, and would consider buying on a pullback to $1,050 or so if you can get it.
A lot of analysts have attributed gold’s rise to the weak U.S. dollar; gold is winning because the dollar is losing. That may be the case, but I believe recent fundamentals have also changed a bit in favor of gold buying for other reasons. We have seen some days when gold and the dollar have both been up, so there is not a perfect negative correlation.
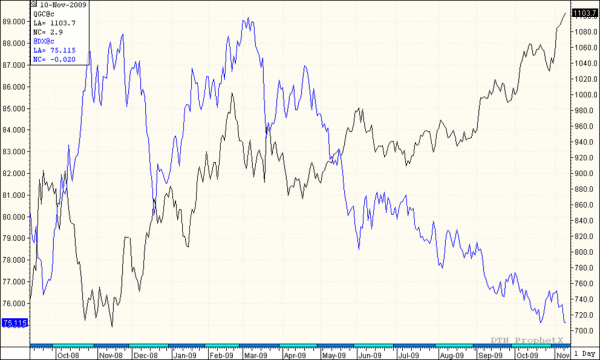
Recently the IMF came out and said they wanted to sell just over 400 tons of gold, and the price of gold futures fell back from $1,060 to $1,030. At that time, no one knew if there was actual demand. Then we saw India buy 200 tons of it, $6.7 billion worth, the largest one-time central bank purchase in recent history. Everyone got the message this wasn’t a speculative bubble, there is real demand. That purchase caused gold to skyrocket to new record highs in early November. Whenever gold goes on the market, people are buying it. Over the weekend of November 7, G-20 members said they would continue their global stimulus measures; that is, they would continue pumping money into the economy. When money is pumped into the economy, what typically results is inflation. Right now we are in a deflationary environment, but when there is fear of potential inflation, gold is considered a safe bet as a hedge.
People tend to look at gold in terms of the U.S. dollar. It’s true the U.S. government has a weak dollar policy. However, other countries, including Great Britain and Japan, also are pursuing weak dollar policies. The euro, Canadian dollar and Australian dollar have been strengthening, and gold has been flat in these currency terms. To me that means there is more room for gold to move higher.
I think every investor should have a little gold of some type in their portfolio. Similar to natural gas, you have both full and mini-sized COMEX contracts if you’d like to trade futures.
Full Gold
100 ounces
$10 move is $1,000
$4,500 margin requirement (current; subject to change)
$110,000 contact value (current; subject to change)
E-Mini Gold
33 ounces
$10 move is $330
$1,800 margin requirement (current; subject to change)
$36,300 contract value (current; subject to change)
In either natural gas or gold, there are also various options strategies you can pursue. Please feel free to contact me for more details on specific trade strategies you might pursue.
Drew Shaw is a Junior Market Strategist based in Toronto with Lind-Waldock, a division of MF Global Canada Co. Drew is accepting Canadian clients can be reached at 877-840-5333 or via email at dshaw@lind-waldock.com.
The data and comments provided above are for information purposes only and must not be construed as an indication or guarantee of any kind of what the future performance of the concerned markets will be. While the information in this publication cannot be guaranteed, it was obtained from sources believed to be reliable. Futures and Forex trading involves a substantial risk of loss and is not suitable for all investors. Past performance is not indicative of future results. Please carefully consider your financial condition prior to making any investments. Not to be construed as solicitation.
©2009 MF Global Ltd. Lind-Waldock, a division of MF Global Canada Co. Toll-free 877-501-5463. MF Global Canada Co. is a member of the Canadian Investor Protection Fund.
Futures Brokers, Commodity Brokers and Online Futures Trading.
123 Front St. West, Suite 1601, Toronto, Ontario M5J 2M2


