
Natural gas futures fell to a seven-year low after the release of weekly inventory data from the Energy Information Administration. NYMEX September futures slid under $3 per million British thermal units. The question is, how low can natural gas go?
The EIA reported an injection into storage of 52 billion cubic feet for the week ended Aug. 14, slightly below analysts expectations but not far off enough to spark a rally. The figure was well below last year’s 82-bcf injection, but in line with the five-year average injection for this time of year at 56 bcf, according to the EIA. The latest build brings the total amount of gas in storage to 3.204 trillion cubic feet, 19.1 percent above the five-year average and 21.3 percent above last year’s level as of Aug. 14.
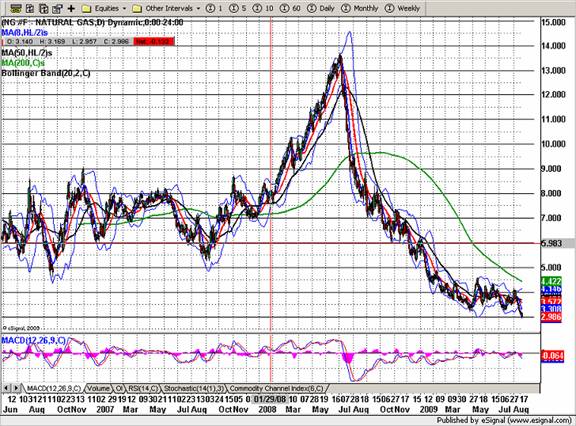
This morning I tweeted about natural gas prices (follow me on twitter here: http://twitter.com/LWMKrupski ) and made a remark regarding the apparent “cheapness” of natural gas. If you look at daily chart of natural gas prices over the last three years, you can see that the contract is currently below its 200-day, 50-day and 20-day moving averages, and significantly below the lowest prices over that time period.
There are fundamental reasons for the current prices. Take a look at the graph from the EIA’s web site, and summary, below.
EIA Summary
Working gas in storage was 3,204 Bcf as of Friday, August 14, 2009, according to EIA estimates. This represents a net increase of 52 Bcf from the previous week. Stocks were 562 Bcf higher than last year at this time and 513 Bcf above the 5-year average of 2,691 Bcf. In the East Region, stocks were 162 Bcf above the 5-year average following net injections of 46 Bcf. Stocks in the Producing Region were 275 Bcf above the 5-year average of 799 Bcf after a net injection of 1 Bcf. Stocks in the West Region were 75 Bcf above the 5-year average after a net addition of 5 Bcf. At 3,204 Bcf, total working gas is above the 5-year historical range.
Working Gas in Underground Storage Compared with 5-Year Range
The red line shows the current inventory levels, while the gray band illustrates the 5-year average.As you can see from the graph, inventories are currently well above 5-year averages.This can account for the current depressed prices of natural gas. The next question seems to be how low can it go?
Let’s look at prices of natural gas not only over the last three years, but over a longer time period. Here is a monthly chart dating back to the late 1990s.
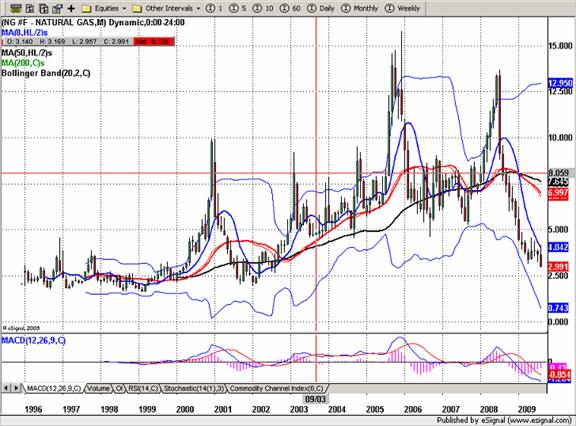
You can see that prices in the winter of 2001 – 2002 went below $2/MMBtu (the low in January of 2002 was $1.96/MMBtu). If inventories continue to build, will prices return to these levels? Nobody knows, but one thing that may prevent natural gas from returning to those levels is the current price of crude oil. Below is a monthly chart of crude oil prices.
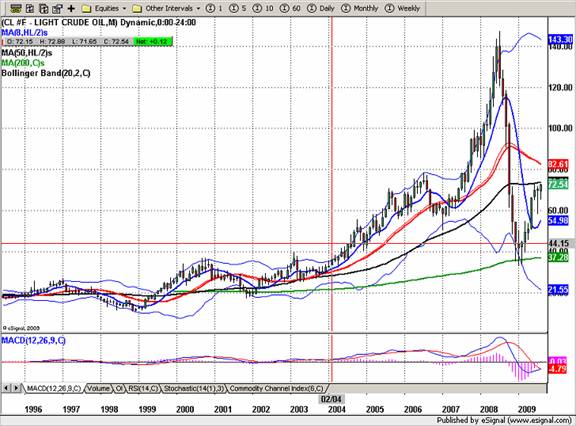
You can see that in the winter of 2001-2002 when natural gas was trading around $2.00-$2.50/MMBUT, crude oil was trading around $20 a barrel.
Crude oil is currently trading around 3.5 times its 2002 price, while natural gas is trading only 50 percent more than its 2002 price. So, what does the price of crude oil have to do with the price of natural gas? When crude oil and crude products become too expensive, some facilities are able to switch between using crude- based products such as heating oil, and instead substitute natural gas. As they switch, they increase the demand for natural gas and decrease available supply, and as a result, prices should increase. The high current price of crude oil when compared to the low current price of natural gas may spur some companies to switch, thereby helping to support the price of natural gas and preventing it from returning to the 2002 price levels.
Other fundamental factors to consider include the state of the economy (as the economy improves, industrial demand should increase), tropical storms (hurricanes can cause producers to quit production decreasing supply), the winter weather (a cold winter should increase demand), producers’ reactions to price levels (producers are shutting down natural gas wells to help limit supply), and the U.S. dollar (a weak dollar makes all dollar-denominated commodities more affordable to the rest of the world, increasing demand).
The final factor to consider is the current term structure of natural gas i.e. “what’s priced in?”Below is a table showing the current prices of natural gas futures:
|
Natural Gas Term Structure |
||
|
Month |
Year |
Price |
|
September |
2009 |
$ 2.97 |
|
October |
2009 |
$ 3.37 |
|
November |
2009 |
$ 4.28 |
|
December |
2009 |
$ 5.08 |
|
January |
2010 |
$ 5.37 |
|
February |
2010 |
$ 5.42 |
|
March |
2010 |
$ 5.40 |
|
April |
2010 |
$ 5.37 |
|
May |
2010 |
$ 5.43 |
|
June |
2010 |
$ 5.53 |
|
July |
2010 |
$ 5.64 |
|
August |
2010 |
$ 5.74 |
|
September |
2010 |
$ 5.81 |
|
October |
2010 |
$ 5.94 |
|
November |
2010 |
$ 6.34 |
|
December |
2010 |
$ 6.72 |
You can see that prices of back-month contracts are significantly higher than the front-month, indicating that people expect the current depressed prices to be temporary.
Feel free to contact me with any questions you might have about options or futures trading, and how to incorporate some of these concepts into specific trading strategies in the markets today.
Matt Krupski is a Senior Market Strategist with Lind Plus. He can be reached at 877-847-3034 or via email at mkrupski@lind-waldock.com.
You can hear market commentary from Lind-Waldock market strategists through our weekly Lind Plus Markets on the Move webinars . These interactive, live webinars are free to attend. To sign up, visit https://www.lind-waldock.com/events/calendar.shtml . Lind-Waldock also offers other educational resources to help your learn more about futures trading, including free simulated trading. Visit www.lind-waldock.com.
Past performance is not necessarily indicative of future trading results. Trading advice is based on information taken from trade and statistical services and other sources which Lind-Waldock believes are reliable. We do not guarantee that such information is accurate or complete and it should not be relied upon as such. Trading advice reflects our good faith judgment at a specific time and is subject to change without notice. There is no guarantee that the advice we give will result in profitable trades. All trading decisions will be made by the account holder.
Futures trading involves substantial risk of loss and is not suitable for all investors. © 2009 MF Global Ltd. All Rights Reserved. Futures Brokers, Commodity Brokers and Online Futures Trading . 141 West Jackson Boulevard, Suite 1400-A, Chicago, IL 60604.

