
By FXEmpire.com
Natural Gas Weekly Fundamental Analysis April 23-27, 2012, Forecast
Introduction: Natural gas is nevertheless a major commodity in its own right, which is used for everything from cooking food to heating houses during the winter. Natural Gas is growing much faster than either of its non-renewable fossil fuel competitors, oil and coal.
Do not miss the weekly U.S. gas inventories report. The figures are issued by the Energy Information Administration (EIA) every Thursday afternoon at 15:30 (released Friday at 15:30 if there was a U.S. bank holiday on Monday). Here’s a link to the latest EIA report. The main natural gas moving figure in there is the change in inventories from the previous week. When it comes to the gas inventories report, we’re talking about billions of cubic feet, Bcf for short.
When the actual change in inventories number is released, it is the deviation from the expected number that is really important. If the actual inventories figure shows a 24 Bcf rise when an 84 Bcf increase was expected, then that is actually positive for the price of natural gas. All else equal, the price of natural gas should rise after the release.
A barrel of oil has roughly 6 times the energy content of natural gas. If the fuels were perfect substitutes, oil prices would tend to be about 6 times natural gas prices. However, due to various market characteristics discussed briefly above and the ease of using oil, the price of oil has been following a pattern of 8-12 times that of natural gas. However that ratio has spiked dramatically since March 2009.
Analysis and Recommendation:
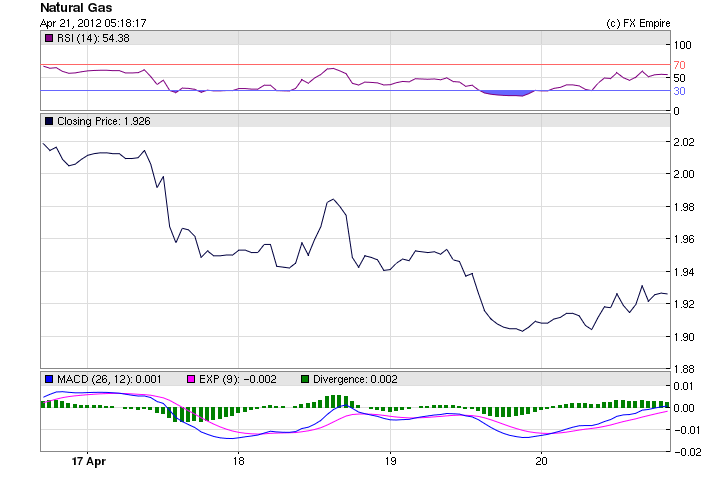
Natural Gas continued to hug the bottom staying below 10 year lows. NG is trading at 1.927 and only inched over the 2.00 price to reach 2.0295 for a short period.
Demand is down, supply is up and there isn’t much that can be done.
As reported earlier this week -The underground natural gas storage (Billion Cubic Feet) increased for the fourth consecutive week; last week the storage levels increased by 1.01% or by 25 Bcf; the natural gas storage settled at 2,512 billion cubic feet for all lower 48 states; the current natural gas storage is 57.7% above the 5-year average, and is also 53.1% higher than the storage at the same week in 2011. As a comparison, during the same week in April 2011 the total natural gas injection was 47 Bcf. This means that the current injection was smaller than a year earlier so perhaps there is an adjustment to the high storage levels.
The increase in storage was primarily because of a 13 Bcf injection from the Eastern consumption region natural gas storage.
Historical:
High 5.13 January 2011
Low 2.2080 March 13, 2012
Economic Events: (GMT)
WEEKLY
- Natural Gas Weekly Update
Release Schedule: Thursday between 2:00 and 2:30 p.m. (Eastern Time) - Weekly Natural Gas Storage Report
Release Schedule: Thursday at 10:30 (Eastern Time) (schedule)
Click here for updated Natural Gas News.
Originally posted here

