
By FXEmpire.com
Natural Gas Weekly Fundamental Analysis April 9-13, 2012, Forecast
Introduction: Natural gas is nevertheless a major commodity in its own right, which is used for everything from cooking food to heating houses during the winter. Natural Gas is growing much faster than either of its non-renewable fossil fuel competitors, oil and coal.
Do not miss the weekly U.S. gas inventories report. The figures are issued by the Energy Information Administration (EIA) every Thursday afternoon at 15:30 (released Friday at 15:30 if there was a U.S. bank holiday on Monday). Here’s a link to the latest EIA report. The main natural gas moving figure in there is the change in inventories from the previous week. When it comes to the gas inventories report, we’re talking about billions of cubic feet, Bcf for short.
When the actual change in inventories number is released, it is the deviation from the expected number that is really important. If the actual inventories figure shows a 24 Bcf rise when an 84 Bcf increase was expected, then that is actually positive for the price of natural gas. All else equal, the price of natural gas should rise after the release.
A barrel of oil has roughly 6 times the energy content of natural gas. If the fuels were perfect substitutes, oil prices would tend to be about 6 times natural gas prices. However, due to various market characteristics discussed briefly above and the ease of using oil, the price of oil has been following a pattern of 8-12 times that of natural gas. However that ratio has spiked dramatically since March 2009.
Analysis and Recommendation:
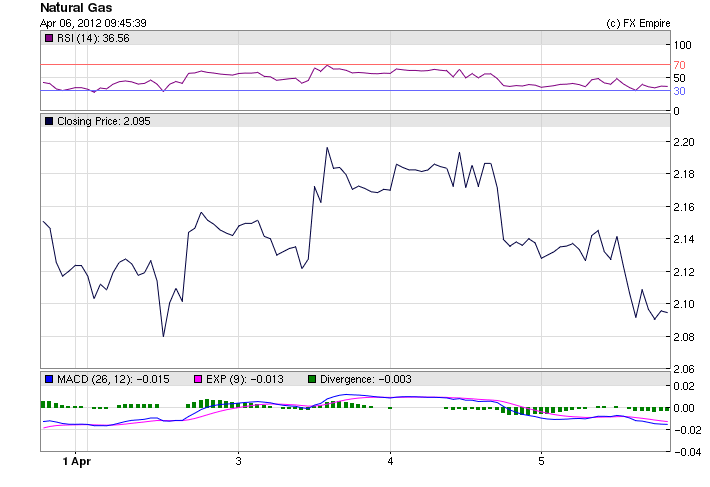
Natural Gas ended the week at 2.095 after falling from the high of the week at 2.203
Natural-gas futures, meanwhile, settled at a 10-year low after an inventories report showed a larger-than-expected increase.
The Energy Information Administration reported an increase of 42 billion cubic feet in supplies of natural gas for the week ended March 30. Analysts expected an increase of 33 to 37 bcf, according to Platts.
Gas fell 5 cents, or 2.4%, to end at $2.09, its lowest settlement since early February 2002. They had traded at $2.14 per million Btus before the data. The settlement brought weekly losses to 1.9%.
Natural-gas futures have suffered from warmer weather and increased production. Prices had settled at 10-year lows in recent sessions.
|
04/05/2012 |
2.095 |
2.139 |
2.159 |
2.084 |
-2.06% |
|
04/04/2012 |
2.138 |
2.170 |
2.197 |
2.130 |
-1.50% |
|
04/03/2012 |
2.171 |
2.143 |
2.203 |
2.118 |
1.31% |
|
04/02/2012 |
2.142 |
2.123 |
2.163 |
2.070 |
0.89% |
|
04/01/2012 |
2.123 |
2.123 |
2.124 |
2.117 |
0.00% |
Historical:
High 5.13 January 2011
Low 2.2080 March 13, 2012
Economic Events: (GMT)
WEEKLY
- Natural Gas Weekly Update
Release Schedule: Thursday between 2:00 and 2:30 p.m. (Eastern Time) - Weekly Natural Gas Storage Report
Release Schedule: Thursday at 10:30 (Eastern Time) (schedule)
Originally posted here

