
The S&P 500 cash index (SPX) closed at 1271.50 on Friday, off a bit from the Thursday high but up 15.13 points or about 1.1% weekly net gain.
For the first trading week of 2011 the bulls won the battle and SPX advanced for the sixth straight week, topping around 1276.83 level. It will likely challenge 1300 ahead. The January effect will encourage more investors to take on higher risk in the form of equity assets.
This week is the beginning of the earning report season. Alcoa Inc. reports 4th quarter earning after the close on Monday. The street expects earning from many companies will be good. Optimism about good earning expectations could help hold the SPX up.
The recent rally in SPX is very tight and stretched, like an elastic band; it could snap back anytime.
But the retail investors who have been withdrawing cash from equity funds from 2008 through 2010, and underinvested Fund managers with money on the sidelines have the potential to spark counter moves on any pullback. “Buy the dips” is still a popular trading strategy.
Technical analysis – SPX
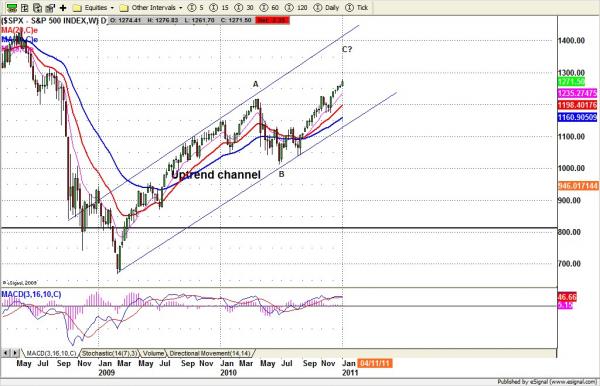
Based on SPX weekly chart (above), the long term and intermediate term upward trend remains intact. The SPX has been above its 200-week moving average line (major intermediate term resistance line) since last November and that is encouraging the sideline buyers to step into this market.
But for the short-term, the market remains overbought and over-believed. The question is whether the 1250 level can hold SPX through January.
Wave structure: the second impulse move hasn’t finished yet. It could end at 1291.33 area or much higher around 1348.89. As long as last Friday’s low 1261.70 holds the SPX up, the price could make new highs to reach 1291.33.
For the short term however, if our CIT day is right Thursday’s high (1276.83) shouldn’t be breached. It needs to hold the price down to continue chewing off the support strength from the 10-day moving average line for a gradual move down step by step to test the 1250-1230 range.
The market sentiment is bullish. AAII reported 55% bullish vs 18% bearish last week, another very high figure. The buyers may continue enjoy a small rally, but with increasing short-term risk.
Monthly resistance 1300 and support 1140; Weekly resistance 1295 and support 1230.
To see Nat’s full weekly preview, including the outlook for e-mini futures, visit www.naturus.com and scroll down on the home page. Free registration required.

