Last week we said the ES might break support around 1275-82.25 and make a continuation low, then bounce back up to retest the breakdown point.
That is pretty much what happened. ES bounced from its low and on Friday re-tested the 82.00-84.00 area.
So far the short-term trend is on the downside. Market sentiment is mixed: AAII reported 28.49% bullish vs. 40.12% bearish after the big decline in the first 3 days of last week. But many street analysts still called for buying the dip.
After a big decline a huge oversold condition was created and the bounce was unavoidable; but despite the oversold bounce we may need to see a big panic move first before the market really starts its bullish rally again.
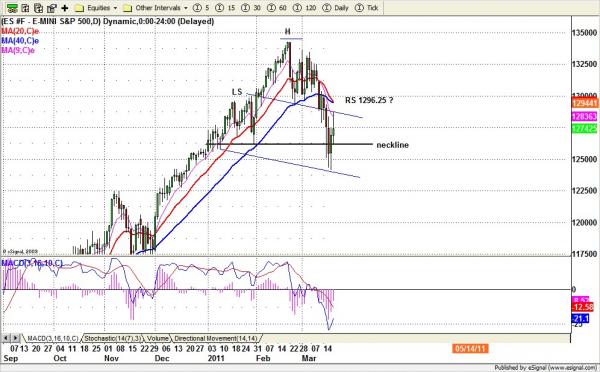
Based on the daily chart, there is a potential H&S pattern forming, which was discussed in last week’s trading plan. We still stand by our view for this pattern as long as price doesn’t move above 1303.50 and close above it.
The right shoulder top could be around 1283.75-1286 or higher up to 1296.25-99.50 range, although the price may not necessarily reach that level.
Based on MACD momentum indicator, it looks like ES needs one more push down to create a bullish divergence on the daily chart after the current bounce is done.
But SST indicator starts to approach oversold territory, and could make the last push down very choppy. It will depend on the intensity of selling pressure.
To see more of Nat’s market analysis, visit naturus.com
ESM1 Daily chart