
The S&P 500 cash index (SPX) closed at 1274.25 on Friday, for a net weekly loss of 30.03 points, down about 2.3%. Last week the nuclear crisis in Japan rattled markets all over the world; combined with quadruple witching week it made for a wild ride in our market.
This week in the early days we may see either a continuation of the bounce from the last two days, or a move down to test our major support zone and a bounce from there. External events will still influence price movements in our market.
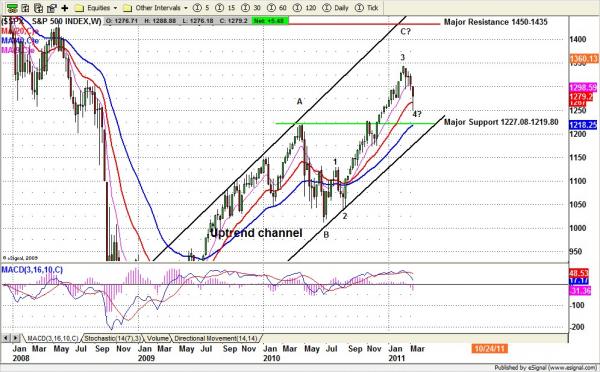
SPX Weekly chart
Technical analysis
Based on the SPX weekly chart (above), the long term trend remains bullish. It hasn’t given any long-term selling signal and all long-term momentum indicators are strong. So far they point to the current short-term move as a counter move in the uptrend that started from the B low on the chart.
For the short term, the second declining wave starting from the 1332.28 high was completed at last week’s low area 1249.05, and Thursday and Friday’s bounces could be a small correction wave. The bounce could move up to 1287-1292 range or up to the gap area 1296.39 (max).
But until this correction move is done, there could also be a final push down, which could move the SPX down to our major support zone 1228-1219.50 range, or lower around 1175-85 range if there is a strong selling pressure.
How long it will take the entire bounce to complete will depend on how fast the oversold condition from the previous five days can be smoothed out.
However, if the price breaks above the 1305-1308 range it could move the price back up to the 1332 area.
If this occurs, it confirms that the declining wave is completed; the final wave 5 toward C destination is in process.
Monthly resistance 1350 and support 1225; Weekly resistance 1300 and support 1225.
To see more of Nat’s market analysis, visit naturus.com

