
The S&P 500 cash index (SPX) closed at 1125.59 on Friday, for a net weekly gain 16.04 points or about 1.4%.
The market spent most of the week in a narrow range near the top of a broad monthly consolidation range (1130-1040). Although there was no breakout move, the upside momentum strength held the market up quite well into the end of the week.
This week we focus on SPX pullback and breakout movement. Last Friday, SPX slightly broke its June’s high 1131.23 on the open and retraced back down for the close. This kind of price behavior indicates a pullback movement likely lies ahead. Also the upside momentum decelerated in the last two days. We may see SPX pull back down above the 1105 area in the early part of the week.
As soon as SPX finds support, the price could rebound back up to 1130 area and make second attempt to breakout. Actions by the Fed — the release of the FOMC minutes Tuesday and the possibility/risk of further intervention in the economy — will be instrumental in determining if the breakout can be successful or not.
Technical analysis
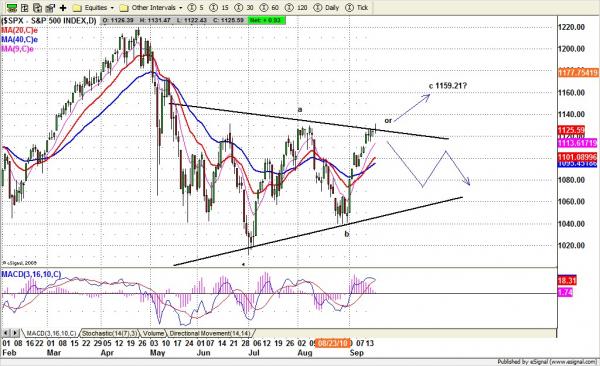
On the weekly chart, there are three possible interpretations of the price patterns.
- One we mentioned earlier is an inverted H&S pattern, which is bullish. The neckline is around 1131.25. If this pattern works, we are likely to have a breakout movement if 1100 holds up strongly in the coming weeks.
- The second pattern is an A-B-C pattern inside sub-wave 2, which could put the C top be around 1159.21. But this pattern also needs to deal with the 1131.25 resistance area first. If there is a failure to break through this resistance, and instead a breakdown of the support around 1093 instead, both these patterns will culminate in buyers rushing for the exit, which could create a big selling pressure.
- The third pattern is a-b-c-d-e pattern — a nasty choppy pattern. This pattern movement could erase the upside momentum for the time being, but later generate a big impulse move. That impulse move could be either up or down, depending on the price level when it begins and positive or negative external news.
Monthly resistance 1150 and support 1000; Weekly resistance 1150 and support 1100
Daily outlook – S&P500 e-mini futures contract ESZ0
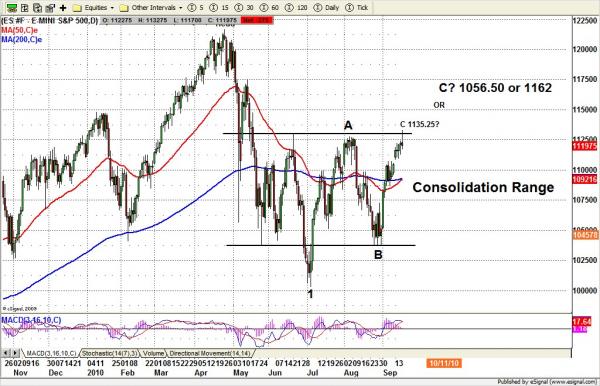
ES has more signs of consolidation than the SPX. The 50-day moving average line is soon going to cross above the 200-day ma, which is usually considered a buying signal. But this signal has not been reliable in recent months — in August a fake buy signal was followed by a 3.7% drop in the price — and the daily chart shows the two ema’s crossing and re-crossing in a whipsaw that is typical of trading ranges.
We are still in a range-bound movement (see the lesson in the training program on range trading methods) and this time the buying signal should be treated as a neutral sign. The ema’s act as a magnet, pulling the price down when it gets above it, and pulling price up when it falls below it, so we expect a pullback to areaaround the 50/200 ema.
Watc h for a pullback that stays above 1100 Monday or Tuesday, especially if ES fails to breakout 1132.75-35.25 range in the early sessions.
This is an abbreviated version of Nat’s weekly market preview. To see the full document, including trading strategies for Monday, go to www.naturus.com. Free registration required.

