More new highs across the board pushed the markets to close above the highs for the two previous years on the last day of April.
Now we are entering the six-month period of negative seasonality from May through Oct. 30.
For the short-term, a price pullback is unavoidable. But the for long term, the uptrend remains intact.
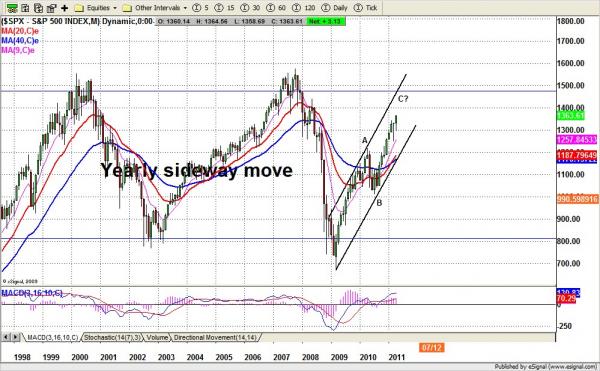
The long term trend from 2009 is up, and the recent buying signal on the monthly indicators remains intact.
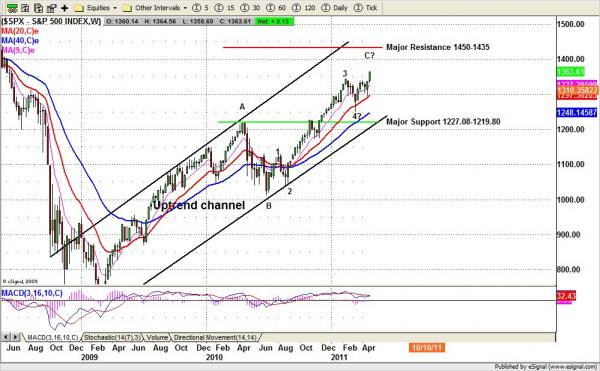
The A-B-C pattern still hasn’t completed yet. The C target 1428.69 should be a next major upside target.
This is an excerpt from the Naturus weekly Market Preview. To see the full preview, visit http://naturus.com
SPX Monthly chart
Technical analysis
Based on the SPX weekly chart (below), the price broke out of the first quarter consolidation range (1300-1345) and made a move higher. The breakout move was confirmed by the price, and the volume for the advance from the 1294 low has also been pretty good.
All this indicates the intermediate-term uptrend remains intact. The price could carry up to 1411.64 or higher with 1371.52-1381 as a minor short-term resistance level.
For the short term, SPX broke out the neckline of the inverted H&S pattern and closed above the neckline.
The price action was bullish, but all short-term momentum indicators are moving into overbought territory, so some short-term pullback can be expected.
This week, price could move higher first before it pulls back into the 1345-40 range for testing.
Monthly resistance 1385 and support 1300; Weekly resistance 1375 and support 1300