
The S&P 500 cash index (SPX) closed at 1337.38, net gain 17.7 points for the short week. The DOW above 12500 level for the first time in nearly three years.
The Easter seasonality may continue driving the price higher this week. The charts also reveal a potential bullish inverted H&S pattern in the making.
This is an excerpt from the Naturus weekly Market Preview. To see the full document, visit http://naturus.com
Weekly Outlook – S&P500 Cash Indix (SPX)
Weekly chart SPX
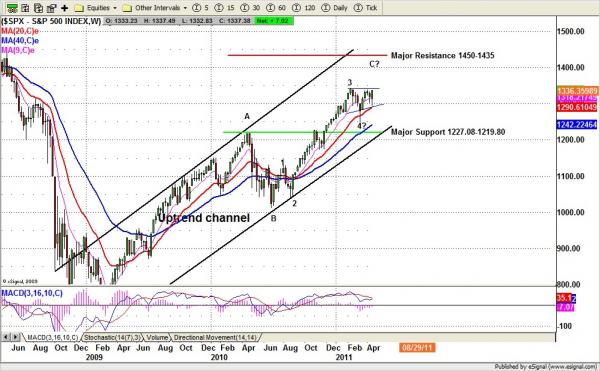
Technical Analysis
Based on the SPX weekly chart (above), the 1340-1345 range is currently a noteworthy resistance level. This will become this week’s key range.
Bulls have been holding the price above the major support zone since the first day of 2011, and have now moved back to the 1340 area for the second time.
A break above 1345 will create a small ascending triangle pattern breakout move, which could push the price up to at least 1385.11 and perhaps as high as 1420-1430 (max).
Last week the overbought condition was smoothed ouyt after SPX pulled back into the weekly 20ema line. The MACD and SST momentum indicators may resume their upward trend to help the SPX make new highs.
The market volatility (VIX) broke 15 support level last week. It indicates VIX still has some room to move lower. But this room may well have its limits.
We should not ignore the low level in the VIX. It could be signaling a top. Until the SPX breaks above the major resistance level around 1345 , we have to be cautious about the possibility of a pull back that will trap the long side.
This is a busy week for earning reports which may continue to support the market high move.
There are also economic reports due this week could have a mixed impact.
There is also a Fed rate decision on Wednesday that has the potential to rock the market.
We have a lot going on; keep you eyes open.
Monthly resistance 1375 and support 1275; Weekly resistance 1350 and support 1300

