
The S&P 500 cash index (SPX) closed at 1332.41 on Friday, net weekly gain 18.61 points, up about 1.42%. Even though March was flat, the first quarter of 2011 had an impressive gain.
This is the first week of the second quarter. The bullish April seasonality may continue dominating this market. The SPX could retest its Feb. high.
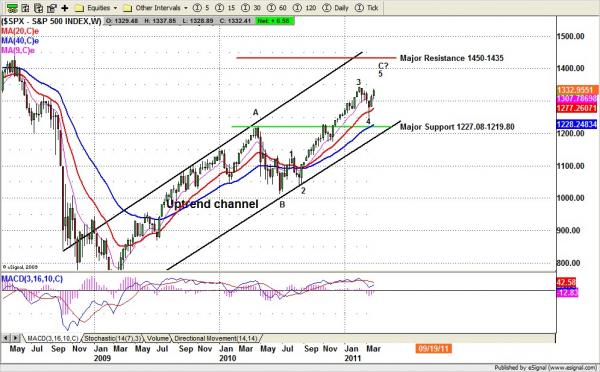
SPX Cash Index – Weekly chart
Technical Analysis
Based on the weekly chart (above), SPX is holding up above 1308, the first weekly major support line, and this line needs to hold to help SPX achieve a new high. Elliott Wave theory says the sub-wave 5 could be equal to the sub-wave 1 move, which indicates the top of sub-wave 5 could be around the 1370.16 area.
For the short term, the Fibonacci extension resistance level will be around 1355-1360 area. Both levels are major key resistance zones and will become the first strong resistance area for the buyers.
The market volatility index has been brought back down to its major support line around the 16 area. The SPX may adopt a slow advance-pause-advance mode to achieve new highs.
So far as external influences on the market are concerned, the QE2 program still has two months left. So far there is no sign from Fed will stop running QE2 despite the drop in the official unemployment rate to 8.9% from 10.25%.
The Fed may well switch their focus from unemployment into some other area. But no matter what topic is chosen, one thing will not be changed: devaluing the US$ and forcing other nations to share our debt is the unspoken intention of both the Fed and the Treasury.
Monthly resistance 1375 and support 1275; Weekly resistance 1350 and support 1300
To see more of Nat’s market analysis, visit http://naturus.com

