
Weekly outlook – S&P 500 Cash index (SPX)
The S&P 500 cash index (SPX) closed at 1176.80, a gain of 53.27 points or about 4.7% for the week.
After 4 straight weeks of declines, last week SPX had a short-term oversold bounce. Hope for the possibility of a new stimulus plan drove the price back up. The Fed Chairman Bernanke understood well public enthusiasm for QE3, and sent a message that Fed may take a deep look at the options for the next meeting on Sept 20. He continues to encourage traders and investors to stay in the market for a few extra weeks.
This week is the end of August and the beginning of September. There is also shortened trading due to the Labor Day holiday a week today. Early in the week we may see a small pullback move and a bounce back up higher in anticipation of the holiday.
SPX Weekly chart
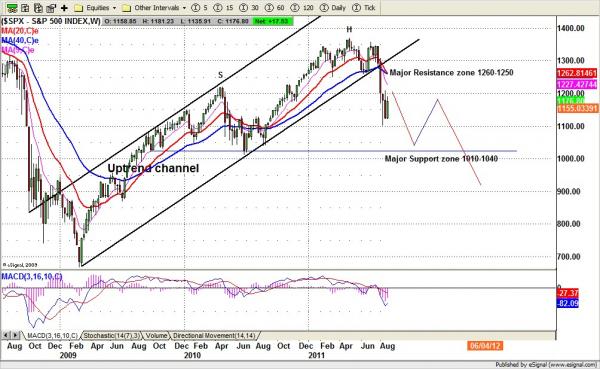
Technical analysis
Based on the SPX weekly chart (above), SPX found its short-term low around 1101 area and holds price up. But the intermediate-term declining move hasn’t completed yet. After the current bounce is exhausted, one more decline should still be expected.
The current bounce could push price up a little further, to 1227 or perhaps higher up to 1265 area (max). On the daily chart (not shown) there is a neutral triangle pattern with the key line at 1162.
If we hold above 1162 line this week, there is a chance for SPX to move up to challenge last two weekly highs at 1181.25 and 1190.50, and then a breakout daily triangle pattern move could lead odds to favor a further advance up to the 1227 area.
But if SPX breaks under 1162 it could lead to a dip into the 1130 line. The 1130 line has to hold up until Sept. 20 (the next Fed meeting) to avoid killing public hope for some form of QE3.
The SPX had a “death cross” on the daily chart (50-day moving average line crossing below the 200-day moving average line). As we said last week: “Often about 4 weeks after a death cross occurs the price will bounce back up to the death cross line for testing.” Given the Fed’s encouragement, we may see this bounce occur earlier than we expected. Currently those two lines are lying around 1238.17 and 1148.44.
But lots of things could happen between now and Sept 20. One possible scenario is a solid move up until one week before Sept.20. A second possibility is a quick drop to complete the intermediate-term decline before Sept 16, and then a buy-the-rumor rally back to wait for the Sept 20 meeting. The support/resistance lines at 1190.60 and 1130 will tell us which direction SPX wants to go first.
Monthly resistance 1350 and support 1030; Weekly resistance 1230 and support 1101
This is an excerpt from the Naturus weekly market preview. To view the complete document, register at http://naturus.com

