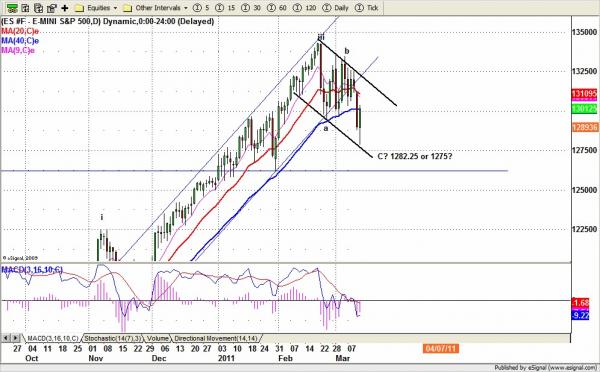
ES broke down the uptrend channel and sped up on the downside. It reached the C target 1282.25-1275 range during overnight trading last Friday, but after the market opened the price traded above the 1286 level all day, which indicated ES could move down to retest 1282.25-1275 range in coming days.
The volume indicators are contradictory. Last Friday the trading volume was lighter than its previous day (combining volume for both March and June) which indicates that after the current bounce ES may continue moving lower.
But looking at the June contract alone, the volume was increasing, which means the A-B-C pattern may be completed. Last Friday’s low may be the low of the next rally and we may see a further bounce.
Because last week was rollover week, the volume may not present an accurate picture and we should concentrate on the price movement instead.
This week ES needs to hold under last week’s high 1323.50.
A move under 1291.00 will confirm last Friday’s low needs to be retested, and somewhere below 1286 line will be the target for the testing move.
A break above 1307.25 will indicate that ES may move up to1312.50-1313.50 range to shake out the shorts.
To see more of Nat’s market analysis, visit http://naturus.com and register. It is free, and there is no obligation of any kind.
ESM1 Daily chart