
The S&P 500 cash index (SPX) closed at 1304.28 on Friday, net weekly loss 16.87 points, down about 1.27%. Last week all major indexes suffered a sharp setback.
This week is triple witching expiration week when options on stocks, on futures and the futures contract itself all expire. Normally there is a lot of chop as traders with large positions attempt to move the market.
This week the Fed Statement and inflation data will be important points of focus for the market. We may see a continuation bounce from last week in the early week, and a sell off later in the week.
SPX Daily chart
Technical analysis
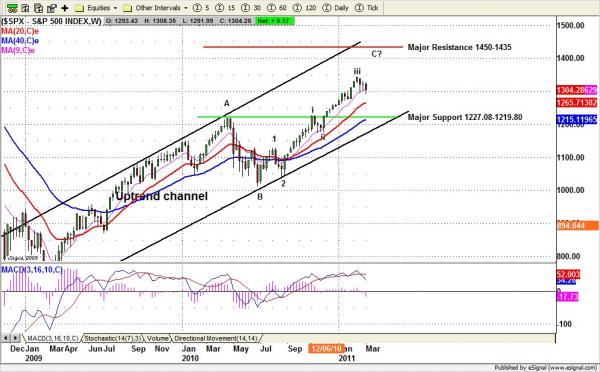
Based on the SPX weekly chart (above), the index pulled the price back into the first key support lines for testing. So far, in the absence of a selling signal for the intermediate and long term, we are treating this pullback as a neutral healthy correction in a bull market.
This correction may continue pulling price down further toward 1265.75 or lower to its major support zone 1227.08-1219. The short-term movement will determine when the correction will be completed.
For the short term, the current declining wave from the 1332.28 high hasn’t completed yet, based on the normal pattern.
Last Friday, the SPX only moved down to 1291.99 and did not reach the first target around the 1282.47 level.
The daily momentum indicators still suggest the SPX still needs one more push down to complete the current decline.
After the big drop last Thursday the SPX had a short-term oversold condition. Then the early Friday sell-off in response to the earthquake in Japan moved the price above the 90% level, an extreme oversold condition.
Later, the price bounced from the low, and pushed up for closing with light daily volume. We may see Friday’s bounce continue one or two days early in the week.
As long as price doesn’t go above 1325 for closing, the short-term trend should remain down until SPX reaches its target in the 1282-1275 range.
Monthly resistance 1350 and support 1250; Weekly resistance 1325 and support 1275
To see more of Nat’s market analysis, visit http://naturus.com and register. It is free, and there is no obligation of any kind.

